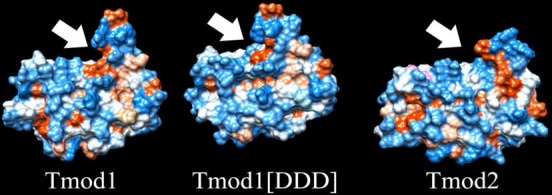
Figure 7.

Hydrophobic surface plots of Tmod structures. Hydrophobic surface plots of Tmod1 (right) and Tmod2 (left) oriented such that the last α-helix is positioned at the top of the frame with the β-strands facing toward the reader. Indicated by arrows are hydrophobic (red) pockets.
