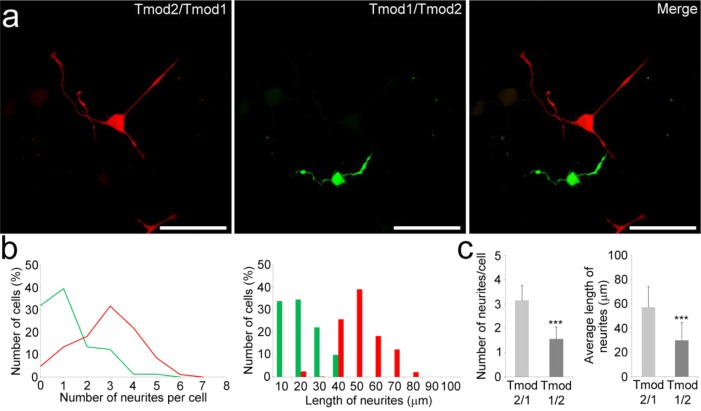
Figure 8.
Comparison of the effect of Tmod1/Tmod2 and Tmod2/Tmod1 chimeras on PC12 cell differentiation. (a) Confocal imaging of PC12 cells overexpressing GFP-Tmod1/Tmod2 cocultured with PC12 cells overexpressing mChFP-Tmod2/Tmod1 after NGF-induced differentiation for 3 days. The bar is 50 μm. (b) Distribution of the number of neurites per cell and distribution of the length of the neurites in PC12 cells expressing the GFP-Tmod1/Tmod2 chimera (green traces and bars) and PC12 cells expressing the mChFP-Tmod2/Tmod1 chimera (red traces and bars). (c) Average numbers of neurites and average lengths of neurites in PC12 cells expressing the GFP-Tmod1/Tmod2 chimera (n = 35; light gray) and the mChFP-Tmod2/Tmod1 chimera (n = 42; dark gray). Error bars represent the standard deviation (***p < 0.0005; one-way ANOVA).

