
Figure 3.
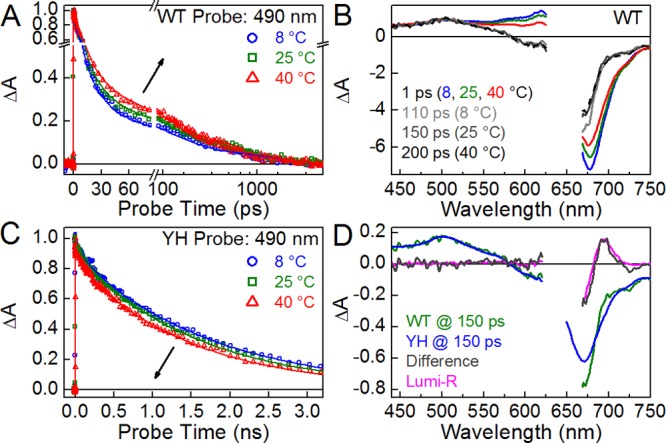
Temperature-dependent PP spectroscopy. PP experiments were performed at 8, 25, and 40 °C (blue, green, and red, respectively). (A and C) Kinetic traces are shown at 490 nm for WT and YH Cph1Δ. Arrows indicate the trend with an increase in temperature. These kinetic traces are fit with respective global analysis models (Figure 5 and Figure S4I–L of the Supporting Information). (B) Comparison of early (at 1 ps) and later (scaled by 5.5-fold, at 110, 150, and 200 ps for 8, 25, and 40 °C, respectively) transient spectra of WT. (D) Comparison between the 25 °C WT and Y176H transient spectra at 150 ps, with a difference between them (gray) compared to Lumi-R (magenta).