
Figure 6.
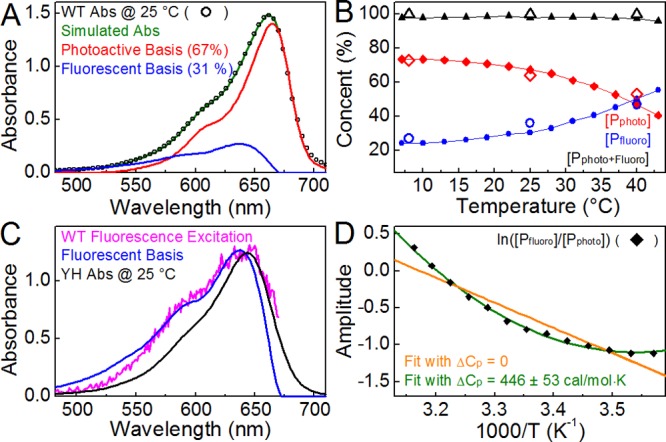
SVD analysis of temperature-dependent absorbance spectra of WT. (A) Photoactive (red) and fluorescent (blue) bases representing Pr 1 and 2 and Pr 3–5, respectively, are compared to the WT absorbance spectra (black) at 25 °C. WT was simulated (green) as 67% photoactive and 31% fluorescent. (B) Temperature-dependent concentrations of photoactive and fluorescent bases were determined for static measurements using SVD (red diamonds and blue circles, respectively) and are compared to those estimated by temperature-dependent PP (empty diamonds and circles). (C) The fluorescent basis (blue) is compared to the YH absorption spectrum at 25 °C (black) and the WT fluorescence excitation spectrum (magenta). (D) van’t Hoff plot for WT Cph1Δ subpopulations extracted from SVD concentrations from panel B. Data were fit to a standard model (orange, ΔCp = 0) and eq 1 (green). The thermodynamic parameters with a standard model fit are as follows (at 25 °C): ΔS = 21.4 ± 2.3 cal mol–1 K–1, ΔH = 6.76 ± 0.68 kcal/mol, and ΔG = 364 cal/mol. Parameters with a fitting according to eq 1: ΔCp = 446 ± 53 cal mol–1 K–1, ΔS = 22.1 ± 0.9 cal mol–1 K–1, ΔH = 7.05 ± 0.27 kcal/mol, and ΔG = 458 cal/mol.