
Figure 3.
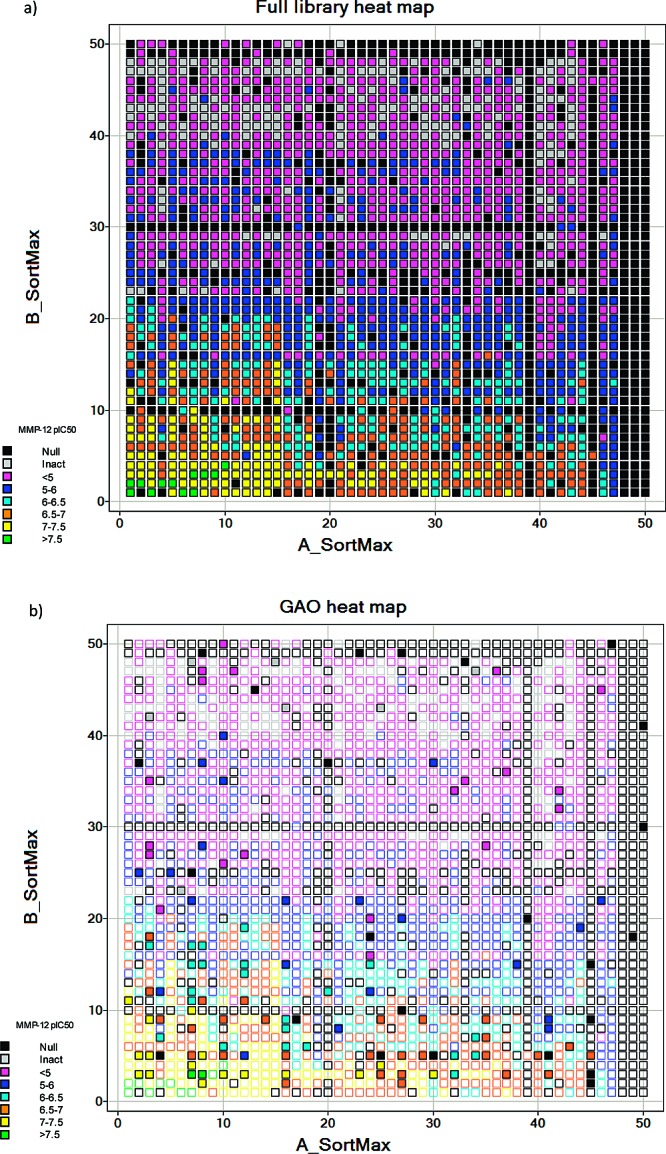
Activity heat maps for the full library and the GAO-optimized library. (a) MMP-12 pIC50 heat map for the full library. (b) Heat map for the GAO library, solid squares; superimposed on the full library heat map, open squares. The reagents are sorted by the activity of the most potent compound containing the reagent.