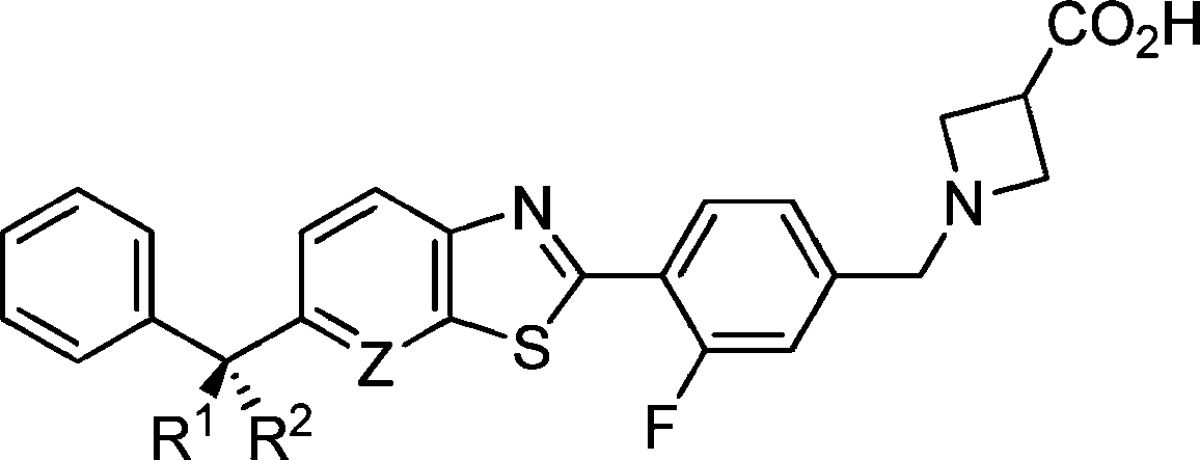
Table 2. Optimization of Thiazolo[5,4-b]pyridine Agonistsa.

| compd | Z | R1 | R2 | hS1P1 RI EC50, μM (% efficacy) | hS1P3 Ca2+ EC50, μM (% efficacy) |
|---|---|---|---|---|---|
| 4d | N | H | H | 0.199 (92) | 0.478 (94) |
| 5a | N | Me | H | 0.035 (99) | 0.877 (44) |
| 5b | N | H | Me | 0.038 (87) | 0.996 (45) |
| 5c | N | Me | Me | 0.033 (103) | 2.51 (64) |
| 5d | N | -(CH2)2- | 0.002 (98) | 0.888 (26) | |
| 5e | N | -(CH2)3- | 0.119 (124) | 1.31 (68) | |
| 5f | N | -(CH2)4- | 0.026 (76) | 12% @ 2.5 μM | |
| 5g | N | -(CH2)5- | 0.033 (108) | 0.836 (41) | |
| 6 | CH | -(CH2)2- | 0.038 (93) | 4.67 (56) | |
Data represents an average of at least two determinations. % efficacy is reported as in Table 1. For statistical analysis, see the Supporting Information
