
Figure 2.
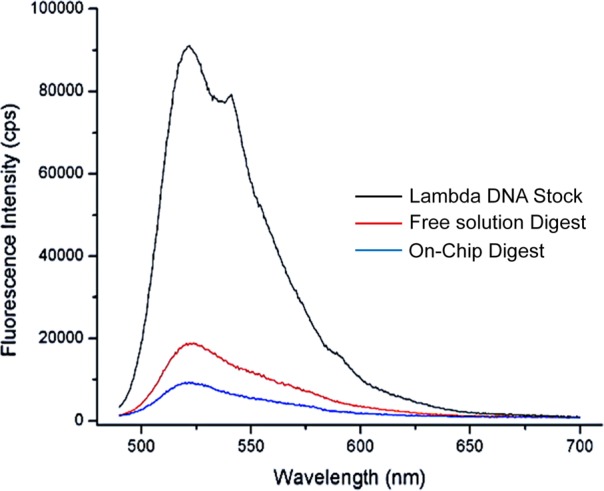
Plot of fluorescence intensity for a λ-DNA stock solution, free enzyme digestion, and the effluent from an IMERs digestion. The emission spectra were taken from 490 to 700 nm with 480 nm excitation. The spectrum labeled in black depicts the intensity of the λ-DNA stock. The blue line represents the spectrum of the IMERS digestion and the red line was that for the free solution digestion. For the IMERs digestion, the amount of immobilized enzyme was 4.96 pmol. For the λ-DNA stock, the IMERs was free of immobilized enzyme. In all cases, the solutions were incubated with PicoGreen following the reaction.