Figure 3.
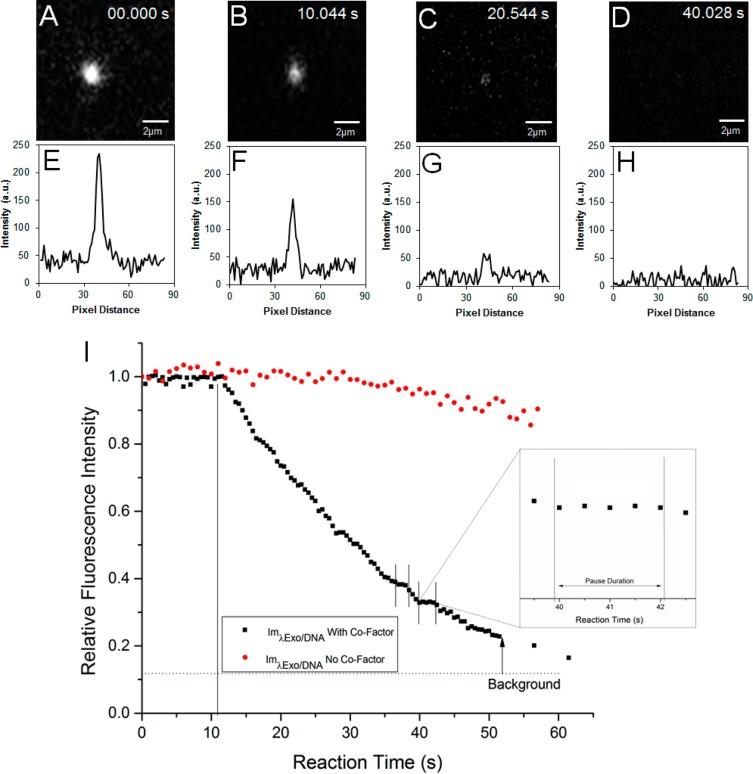
(A–D) Fluorescence still images for the real-time digestion of dsDNA using λ-Exo covalently immobilized to a PMMA substrate configured in the IMER device. (E–H) The corresponding fluorescence intensity line plots taken from the still images shown in parts A–D. In these cases, the line plot was secured from a horizontal line that crossed the section in the still image containing the stained DNA molecule. (I) Graphical depiction of the relative fluorescence intensity of a single dsDNA that was digested by an immobilized λ-Exo molecule as a function of reaction time, where possible pausing events were seen in each inset. Immobilization of λ-Exo was accomplished using EDC/NHS onto a PMMA substrate. The λ-DNA was labeled in a 1:50 dye/bp ratio with YOYO-1. The fluorescence intensity was measured in the presence (black) or absence (red) of the enzyme cofactor, Mg2+. The dotted line for the intensity profile in the presence of Mg2+ indicates the time at which the cofactor was infused into the IMER.

