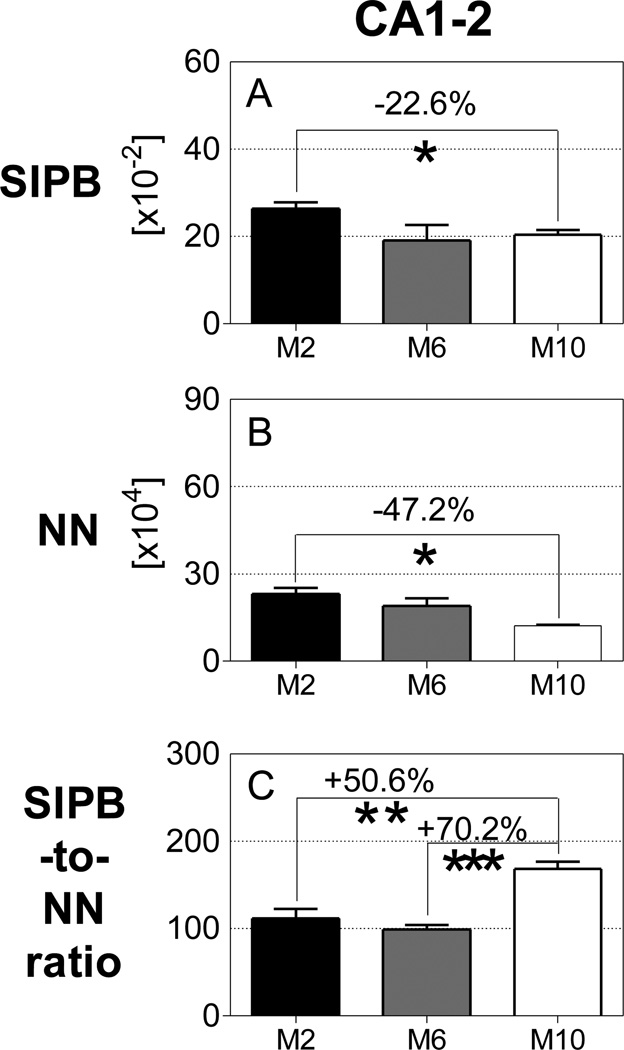
Figure 6.
Mean and standard error of the mean of total number of synaptophysin-immunoreactive presynaptic boutons numbers (A; SIPB), total number of neurons (B; NN) and SIPB-to-neuron number ratio (C; SIPB-to-NN ratio) in the CA1–2 of 2-month-old (M2; black bars), 6-month-old (M6; dark grey bars) or 10-month-old (M10; open bars) APPSL/PS1ho KI mice. Results of post-hoc Bonferroni tests for pairwise comparisons between animals in groups M2 and M6, M6 and M10 and M2 and M10 of the same genotype are indicated in the graphs. *, p < 0.05; **, p < 0.01.

