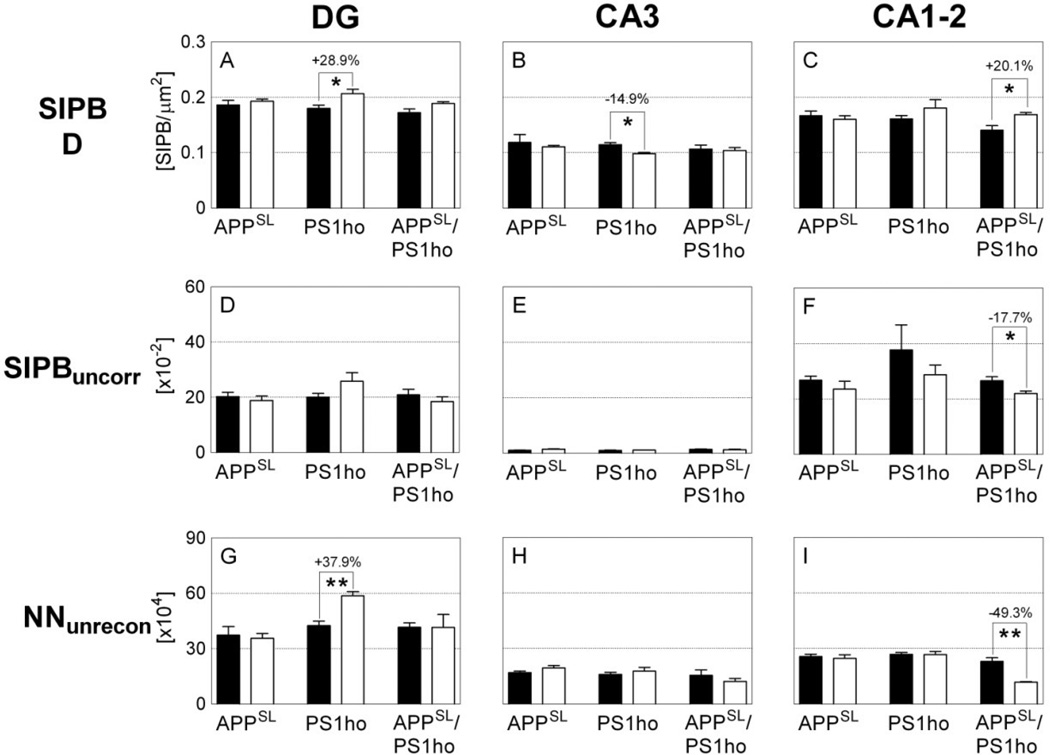
Figure 7.
Mean and standard error of the mean of synaptophysin-immunoreactive presynaptic boutons (SIPB) densities (A–C; SIPB D), uncorrected SIPB numbers (D–F; SIPBuncorr) and unreconstructed total neuron numbers (G–I; NNunrecon) in the DG (A, D,G), CA3 (B, E, H), and CA1–2 (C, F, I) in the hippocampus of either 2-month-old (M2; black bars) or 10-month-old (M10; open bars) APPSL mice (APPSL), PS1ho KI mice (PS1ho) and APPSL/PS1ho KI mice (APPSL/PS1ho). Results of post-hoc Bonferroni tests for pairwise comparisons between animals in groups M2 and M10 of the same genotype (after general linear model univariate analyses of variance was performed) are indicated in the graphs. *, p < 0.05; **, p < 0.01.

