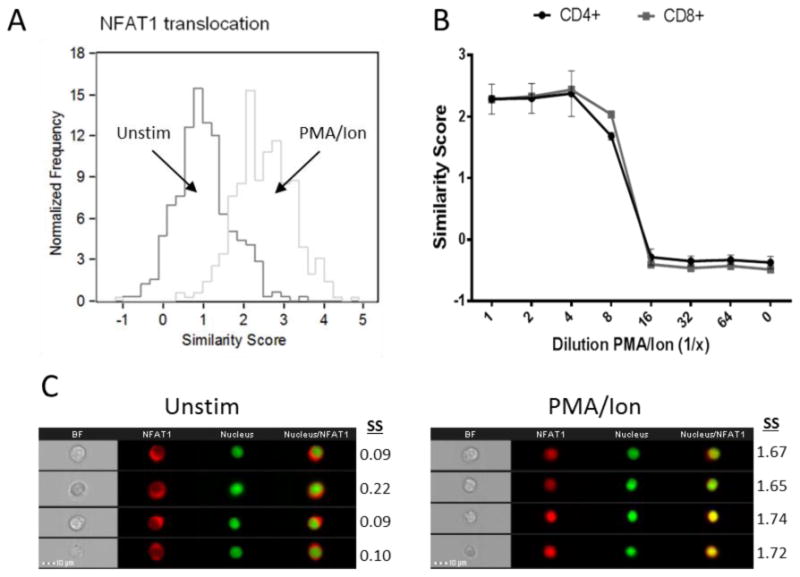
Figure 1. PMA/Ionomycin concentration-dependent stimulation of NFAT1 cytosolic to nuclear translocation quantified by imaging flow cytometry.

Jurkat T cell line treated with PMA/Ionomycin for 30 minutes at 37°C, 5% CO2. Nuclear localization of NFAT1 with stimulation is observed as indicated by a shift in similarity score distribution to the right (Figure A). Whole blood collected from healthy donors and 500 μL stimulated with increasing dilutions PMA/Ionomycin for 30 minutes. A dilution-dependent decrease in activation in CD4+ and CD8+ T cells is observed (Figure B). Results represent the mean and standard error of 2 independent experiments. Representative images of both unstimulated and stimulated populations are also shown with their corresponding Similarity score (SS) (Figure C).
