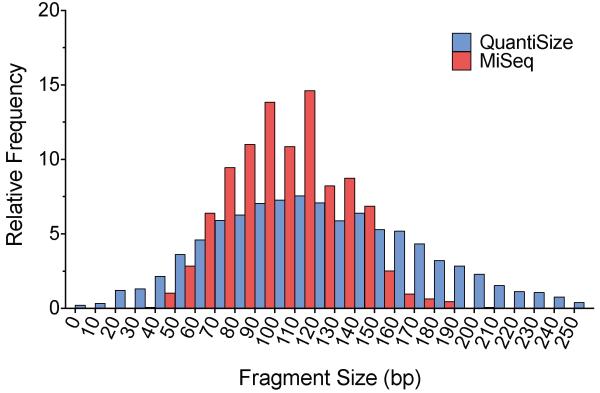
Figure 4. Comparison of library molecule size distribution.
The QuantiSize assay was performed on a DNA library prepared for the MiSeq in order to predict the distribution of library molecule sizes. The DNA library was amplified in parallel with a set of size standards using the same primers and TaqMan probe, allowing us to estimate the expected amplicon size within each individual droplet. The resulting size distribution is shown in blue. The actual size distribution was determined through paired-end sequencing on the Illumina MiSeq system (shown in red). Both histograms show the relative frequency of measured molecule sizes in 10 base pair bins. The size distribution measured by QuantiSize is naturally wider than the distribution measured by the MiSeq due to the inherent variance in droplet amplitude that occurs even with amplicons of the same length. The DNA library was amplified in parallel with a set of size standards using the same primers and TaqMan probe, allowing us to estimate the expected amplicon size within each individual droplet.

