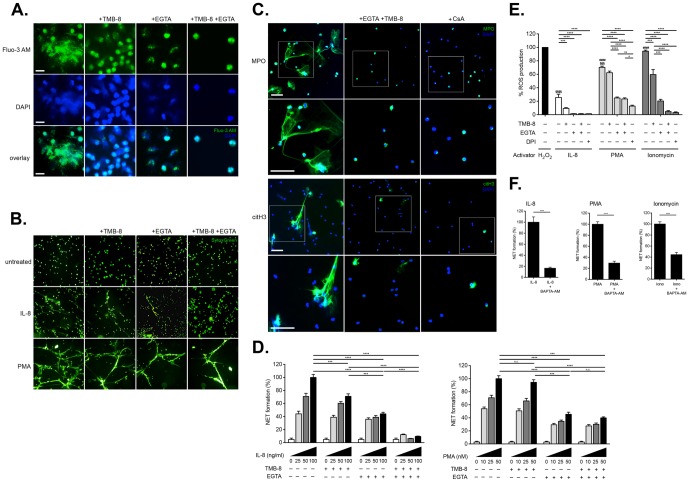
Figure 2. Role of intra- and extracellular calcium pools in the induction of NETosis by IL-8. A. Examination of intracellular calcium mobilization by fluorescence microscopy in IL-8 stimulated neutrophils treated with TMB-8 and EGTA.
Calcium mobilization was triggered by treatment with IL-8. Intracellular calcium utilization was antagonized by TMB-8, while extracellular calcium was chelated with EGTA. Mobilization of intracellular calcium in cells treated with IL-8 was greatly reduced by chelation of external calcium by EGTA or binding of internal stores by TMB-8, and largely abolished by both agents in combination. Magnification: 40x; scale bar: 20 nm. B. Detection of NETosis by fluorescent microscopy using SYTOX Green under calcium sequestering conditions. NETosis induced by IL-8 is greatly reduced by EGTA, to a lesser extent by TMB-8, and completely abolished by the action of both agents. NETosis triggered by PMA was largely unaffected by the action of TMB-8, being more sensitive to the chelation of extracellular calcium by EGTA. Magnification: 10x. NETs generation was normalized as 100% for 10 ng/ml IL-8 or 50 nM PMA treatment. C. Detection of NETs by fluorescent immunohistochemistry following calcium sequestration or treatment with cyclosporine A. The combined action of TMB-8 and EGTA effectively blocked IL-8 induced NETs as detected by the presence of citH3 or MPO. In a similar manner, treatment with the calcineurin antagonist CSA, greatly diminishes IL-8 induced NETs generation. Magnification: 20x; scale bar: 50 nm. Inserts indicate higher magnification view in panel immediately below. D. Quantitative fluorimetric detection of IL-8 or PMA induced NETosis following calcium sequestration. Upper panel illustrates NETosis induced by IL-8, while lower panel illustrates NETosis induced by PMA. For this analysis, neutrophils (1×10⁵/well) were plated in 96-well plates in the appropriately modified medium and activated with increasing doses IL-8 (0–100 ng/ml). Following 1 hr culture, NETs were quantified fluorimetrically and the data normalized as described in Materials and Methods. An analysis from 4 different experiments is shown, and the data are presented as mean ± SEM. Two-way ANOVA with Bonferroni correction were applied to assess differences between multiple groups. Statistically significant P values are indicated in the graphs as follows: ****, P<0.0001 and ***, P<0.001. E. Influence of calcium sequestration on ROS production. ROS was measure via Luminol detection after induction with rIL-8 (100 ng/ml) or PMA (50 nM) or ionomycin (5 µM). H2O2 (50 µM) served as a relative control and considered 100%. DPI (25 µM), a specific inhibitor of NADPH mediated ROS generation, was used to block ROS production and was used as negative control. Extracellular calcium was chelated with EGTA and release of intracellular calcium was antagonized with TMB-8. An analysis from 6 different experiments is shown, and the data presented as mean ± SD (standard deviation). Two-way ANOVA with Bonferroni correction were applied to assess differences between multiple groups. Statistically significant P values are indicated in the graphs as follows: ****, P<0.0001; ***, P<0.001; **, P<0.01 and *, P<0.05. F: Chelation of intracellular calcium reduces NETosis. Neutrophils (1×10⁵/well) were plated in the 96-well plates in triplicates. Cells were pre-treated with 10 µM BAPTA-AM, a cell permeable calcium chelator, for 15 minutes, washed extensively and then activated with either 100 ng/ml IL-8, or with 50 nM PMA, or with 5 µM ionomycin. NETs were quantified fluorimetrically following 1 hour culture as described. An analysis from 8 different experiments is shown, and the data are presented as mean ± SD (standard deviation). Unpaired t-test was used to calculate two-tailed P value to estimate statistical significance of differences between two groups. Statistically significant P values are indicated in the graphs as follows: Statistically significant P values are indicated in the graphs as follows: ****, P<0.0001. The data were normalized as 100% NET formation as induced by treatment with rIL-8 (100 ng/ml), PMA (50 nM) or ionomycin (5 µM) in the absence of any inhibitors.

