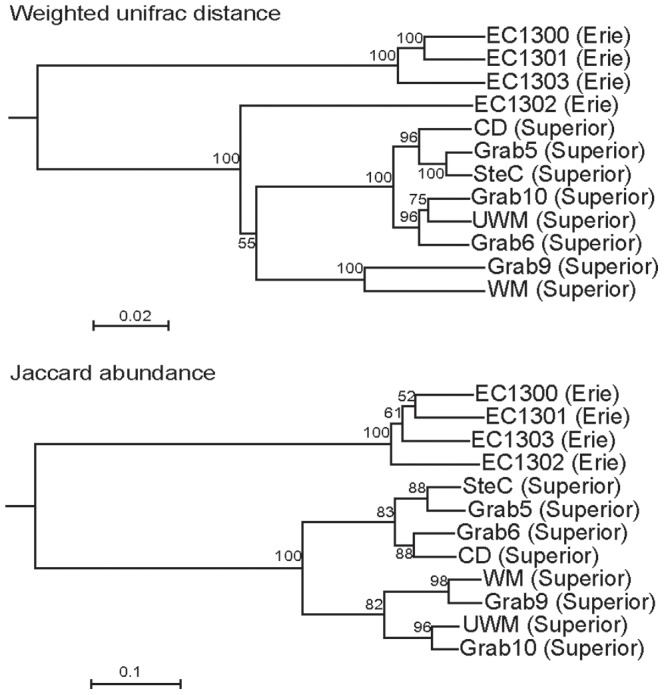
Figure 6. UPGMA clustering of Weighted Unifrac distances (A) and Jaccard abundances (B) of AOA in the sediment of Lake Erie and Superior at 98% similarity.

Numbers at the nodes represent statistical analysis of 100 rarefactions.

Numbers at the nodes represent statistical analysis of 100 rarefactions.