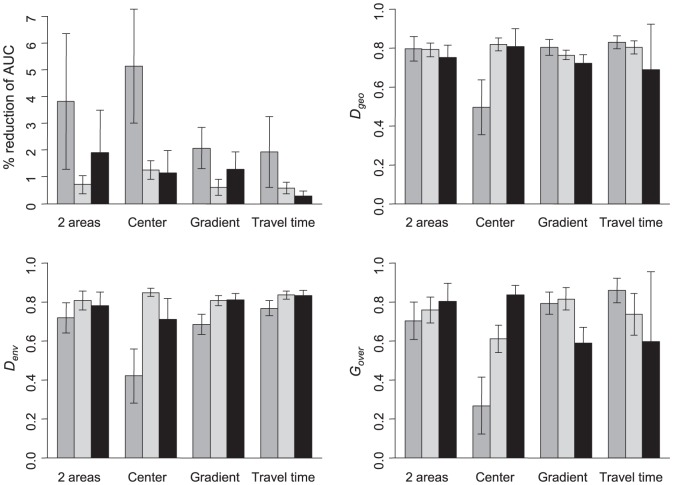
Figure 4. Evaluation indices of biased models across bias intensities.
Reduction of AUC between unbiased and biased models (in percentage), Schoener's D overlaps between biased and unbiased models computed on SDMs (Dgeo) and in environmental space (Denv), and Gover the binary distribution overlap (mean ± SD). Dark grey bars: Chrysemys picta, light grey bars: Plethodon cylindraceus, black bars: virtual species.

