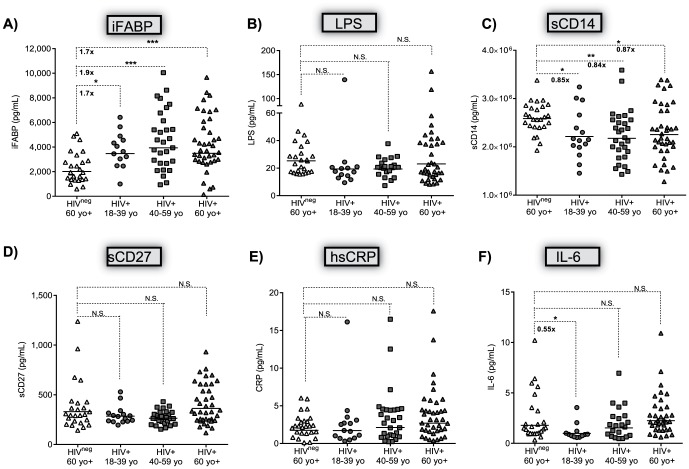
Figure 3. Comparing the plasma concentration of IEBD, MT, and inflammatory markers in elderly HIVneg subjects to HIVpos subjects stratified by age.
Subjects were stratified into three age groups: young adult- 18–39 years of age; middle aged- 40–59 years of age; and elderly- >60 years of age. The biomarker concentrations were natural log transformed and compared between groups using an ANOVA, a p-value < 0.05 was considered significant. The Benjamini-Hochberg method was used to control false discovery rate (FDR) at the 0.05 level. The horizontal line indicates the geometric mean of each group. The fold-change is indicated when differences between the groups were significant. N.S. – not significant. * - p = 0.05–0.01; **- p = 0.0065; ***- p = 0.0002. Each group is represented by the same symbol throughout the figure: HIVneg subjects > 60 years of age- open triangle; HIVpos young adults- closed circle, HIVpos middle aged adults- closed square, HIVpos > 60 years- closed triangle. (A) iFABP, (B) LPS, (C) sCD14, (D) sCD27, (E) hsCRP, and (F) IL-6.

