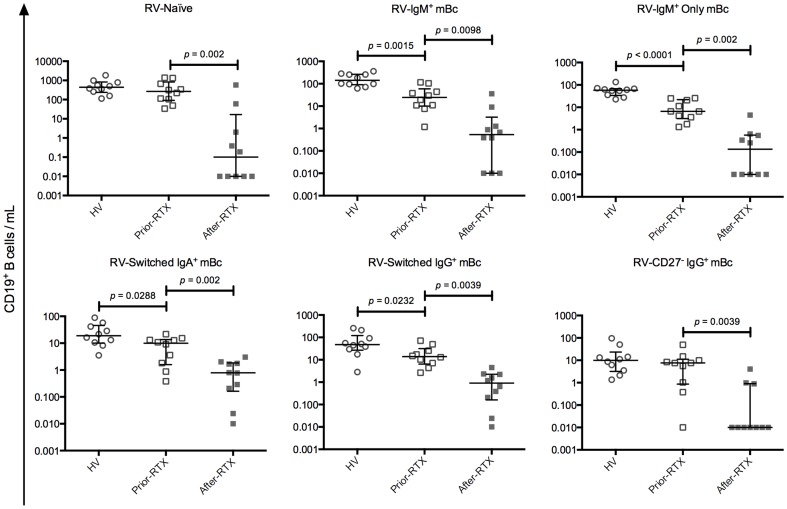
Figure 3. Comparison of RV-specific B cell subpopulations among the study groups.
Solid lines and error bars denote the median and interquartile range, respectively. Differences between HV (n = 10) and patients prior-RTX (n = 10) were evaluated with Mann–Whitney tests and between patients prior-RTX and patients after-RTX (n = 10) with Wilcoxon tests. All p values reported are 2-tailed.

