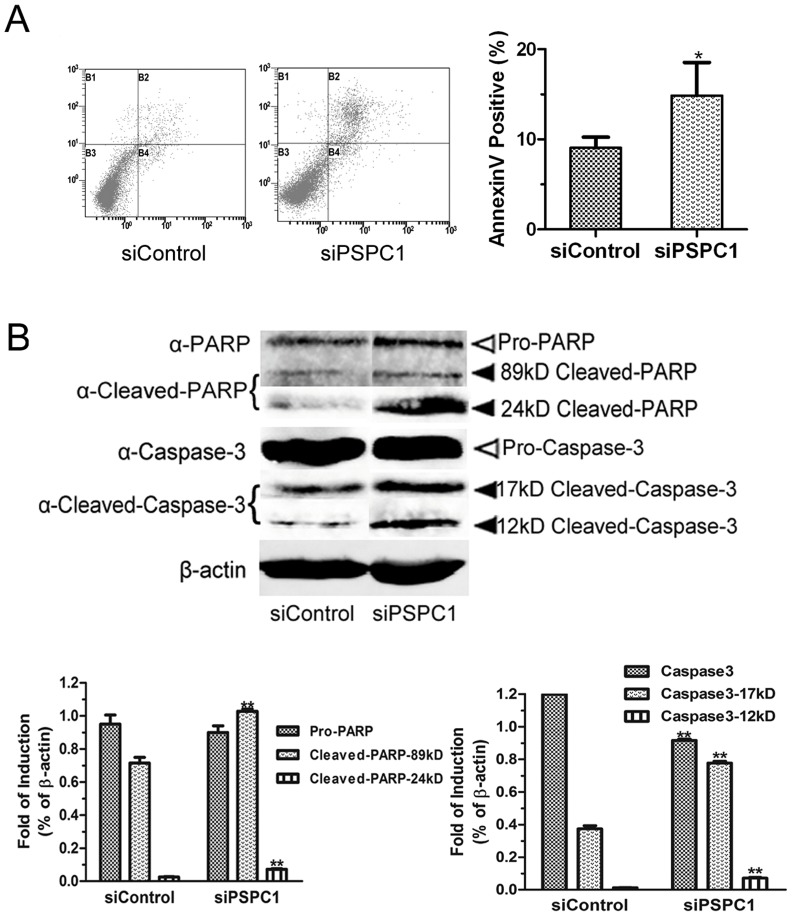
Figure 3. Knockdown of PSPC1 induces cell death.
(A) HeLa cells harvested at 24 h post-transfection were analyzed by dual-parameter flow cytometry utilizing Annexin V-FITC and PI. Representative dot plot data from three independent experiments are shown in the left panel, and the histogram graph at right represents the percentage of dual-parameter positive cells pooled from three independent experiments. (B) HeLa cells harvested at 24 h post-transfection were analyzed by Western blotting to evaluate the expression of Caspase-3 and PARP. Densitometric data of three independent experiments are presented below the immunoblot, and β-actin was used as an internal standard. Data are presented as mean ± SD. *P< 0.05, **P< 0.01, compared with control group.

