
Figure 2. Injection of MOsp affects the splicing of adar2 transcript.
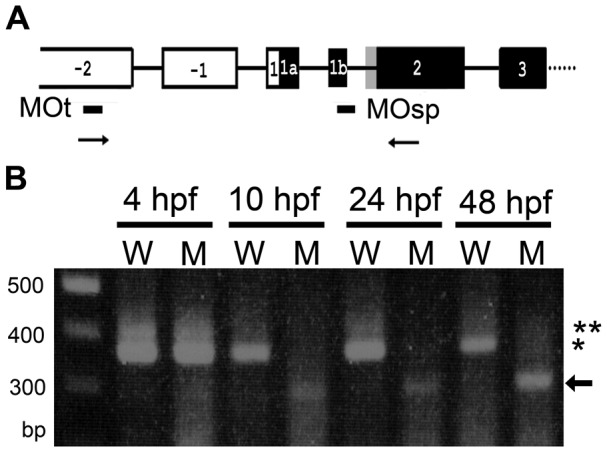
(A) 5′ gene structure of adar2. The gene structure is assigned by Slavov and Gardiner [14]. The non-translated and translated exons are respectively depicted in open and filled rectangular boxes. The gray box depicts the 47-bp alternatively spliced exon. Editing of the A upstream to the gray box results in the alternative splice to include the 47 bp sequence (+47 transcript). The locations of annealing sites of antisense morpholinos, MOsp and MOt, and PCR primers to check the effects of MOsp are indicated as lines and arrows below the gene structure, respectively. (B) Splicing of adar2 is perturbed by injecting MOsp. RT-PCR was performed with RNA extracted from wild type (W) and adar2MOsp (M) of various development stages (hpf) shown on top of ethidium-bromide-stained agarose gel. An equal amount of cDNA that gives rise to the same amount of actb1 amplicon was used to amplify adar2. Sizes of molecular markers are shown on the left side of the gel. Asterisk and double-asterisk respectively indicate the products of normal and edited (+47) adar2. Arrow indicates major aberrant splice products.