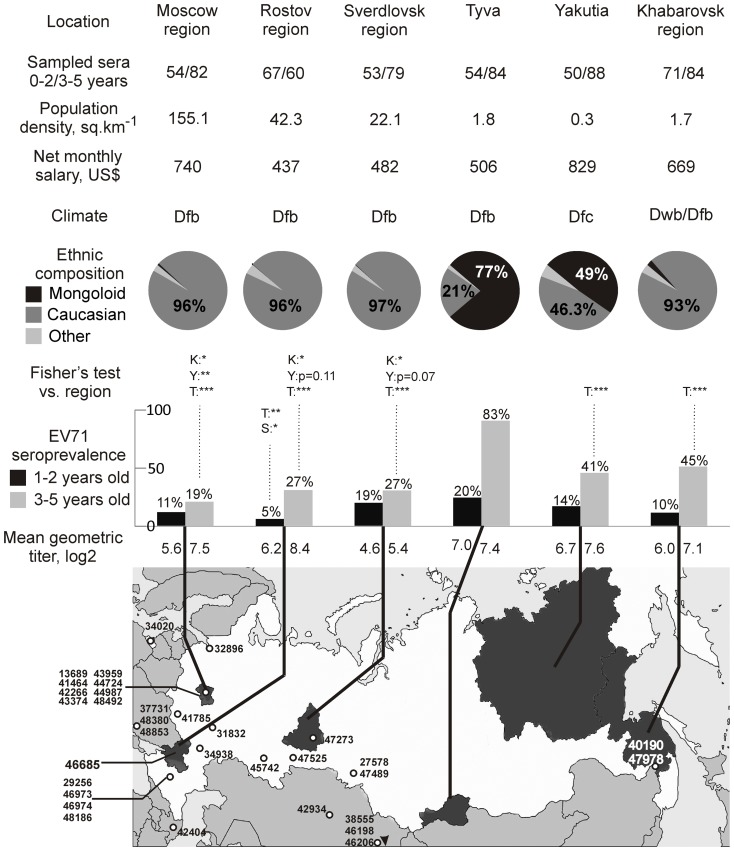
Figure 1. Sampling territories (shaded on the map), the number of sampled sera, sociogeographic conditions in the study regions, prevalence and mean geometric titers of antibodies to EV71 in children aged 1–2 and 3–5 years.
Social and economic status of the regions is provided according to the official census and statistical data. Climate zone is indicated in accordance with Köppen classification. Dfb, warm summer continental, even annual rainfall; Dfc, continental subarctic, even annual rainfall; Dwb, warm summer continental, low winter rainfall. Isolations sites of EV71 strains presented in Fig. 2 are indicated with empty circles. Significance of Fisher's exact test comparing seroprevalence in younger and elder age groups is indicated above the bars of the seroprevalence graph; comparison regions are indicated by first letters. Only significant values are shown; * indicates p<0.05, ** p<0.01, *** p<0.001.

