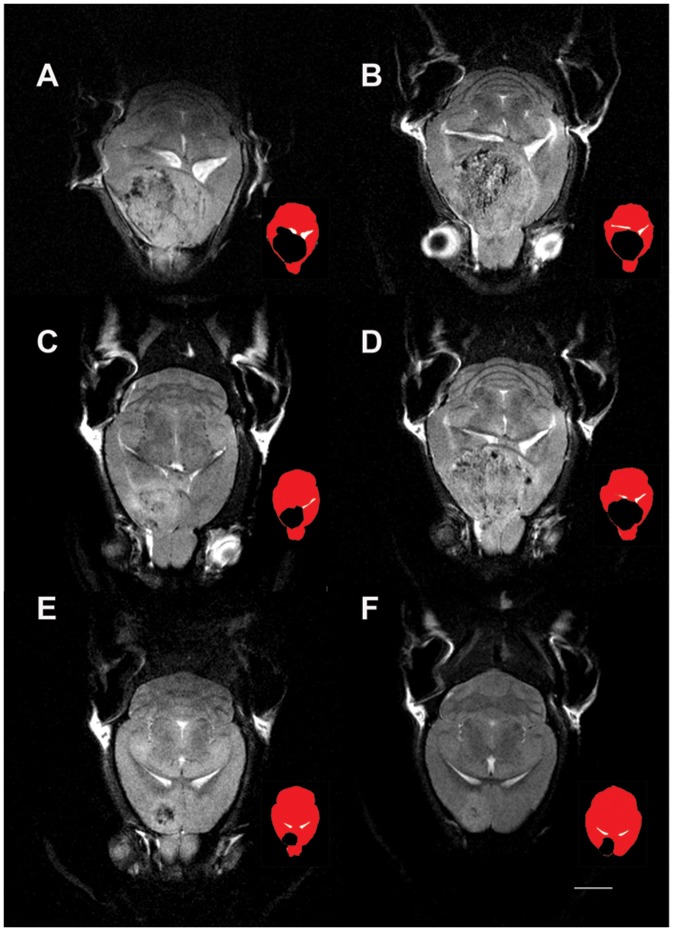
Figure 4. Glioblastoma size varies in the RCAS-TVA-J12p16/M9Pten mouse model.
T2-weighted horizontal MRIs at the level of the lateral ventricles from four RCAS-TVA-J12p16/M9Pten mice with large glioblastomas (GBMs) (Fig. 4, A–D) and two RCAS-TVA-J12p16/M9Pten mice who developed smaller frontal GBMs) (Fig. 4, E–F) are shown. For each MRI image, a corresponding color-coded icon is shown to the right illustrating the GBM (black) in relation to ventricles (white) and the rest of the brain (red). As can be seen, the larger GBMs are compressing the lateral ventricles and incorporate both hemispheres. The T2-weighted MRIs of the mice with large GBMs demonstrate that the tumor tissue contain scattered areas associated with lower signal intensity and further that tissue at the edge of the tumor often is associated with brighter signal intensity. The smaller GBMs in Fig. 4E and F are located in frontal cortical areas and also contain tissue with mixed low and bright signal intensities. Scale bar = 2 mm.

