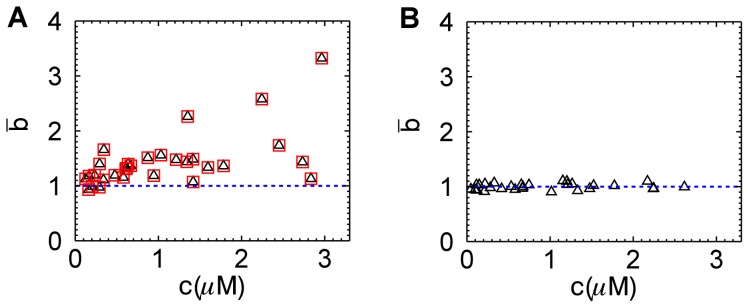
Figure 1. Normalized brightness of EGFP versus concentration.

(A) EGFP in yeast cells results in brightness values that scatter from 1 to 3. Brightness is analyzed by PCH analysis (triangles) and by moment analysis (squares). (B) EGFP in U2OS cells exhibits a brightness close to 1 at all concentrations as expected for a monomeric protein. The blue dashed line represents the brightness value expected for monomeric EGFP.
