
Figure 2. Fluorescent intensity decays in yeast cells and its effect on brightness values.
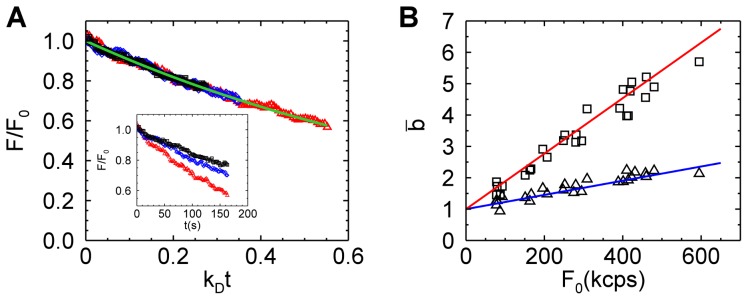
(A) The fluorescent intensity decay from three different cell experiments (black, blue, and red symbols) is graphed versus the scaled time  . An exponential decay function
  (green line) describes the experimental fluorescent intensity curves. The decay rate coefficient
  of the three cells differ (inset). (B) Brightness versus the initial intensity for data with a photodepletion fraction
  = 0.1 (triangles) and
  = 0.2 (squares). Modeling by Eq. 4 with photodepletion fractions of 0.2 and 0.1 is shown as the red and blue solid line, respectively.