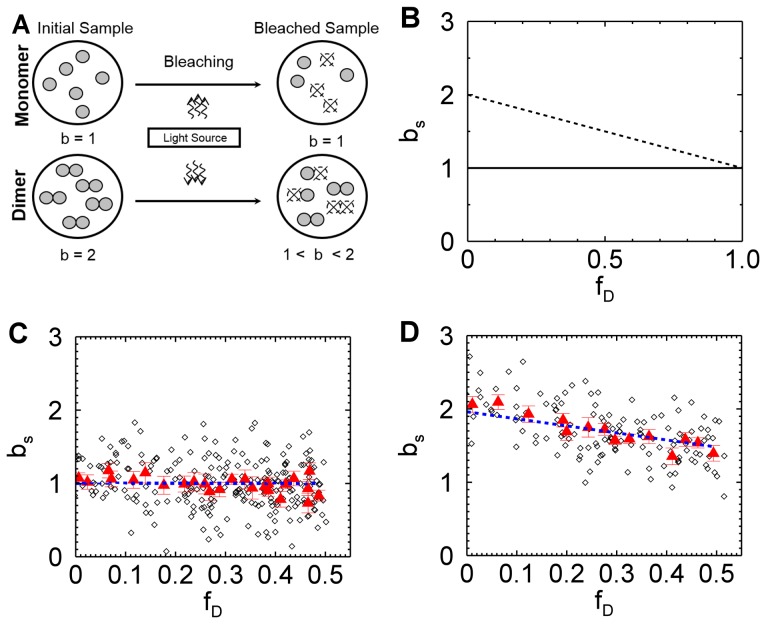
Figure 4. Segmented brightness analysis of monomers and dimers.
(A) Illustration of photodepletion for monomers and dimers. Fluorescent molecules are depicted as filled circles and photobleached molecules are pictured as broken circles. The normalized brightness of monomers (b = 1) remains unchanged by photodepletion, In contrast, photobleaching of a dimeric sample with initial brightness of 2 leads to a reduction of brightness as explained in the text. (B) Theoretical brightness based on segmentation analysis of a monomeric (solid line) and dimeric (dashed line) sample as a function of photodepletion. (C) Brightness of EGFP from a yeast cell by segmentation analysis versus photodepletion fraction. Brightness values (diamonds) for a data segment size of 1.6 s. Ten consecutive brightness values are averaged (red triangles) to better visualize the trend of the data. The dashed blue line represents a fit of the brightness values to Eq. 6 with a fitted value of  . (D) Brightness of EGFP2 from a yeast cell by segmentation analysis versus photodepletion fraction. Symbols are described under (C). The blue dashed line represents a fit of the brightness values to Eq. 6 with a fitted value of
  .
.

