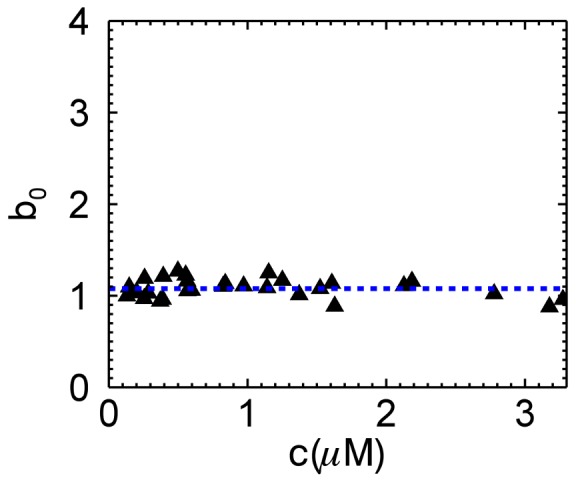
Figure 5. Normalized brightness of EGFP versus concentration in yeast cells.

The same data shown in Figure 1A are reanalyzed with segmented brightness analysis, which removes the bias (mean and SD of brightness data: .1.08±0.10).

The same data shown in Figure 1A are reanalyzed with segmented brightness analysis, which removes the bias (mean and SD of brightness data: .1.08±0.10).