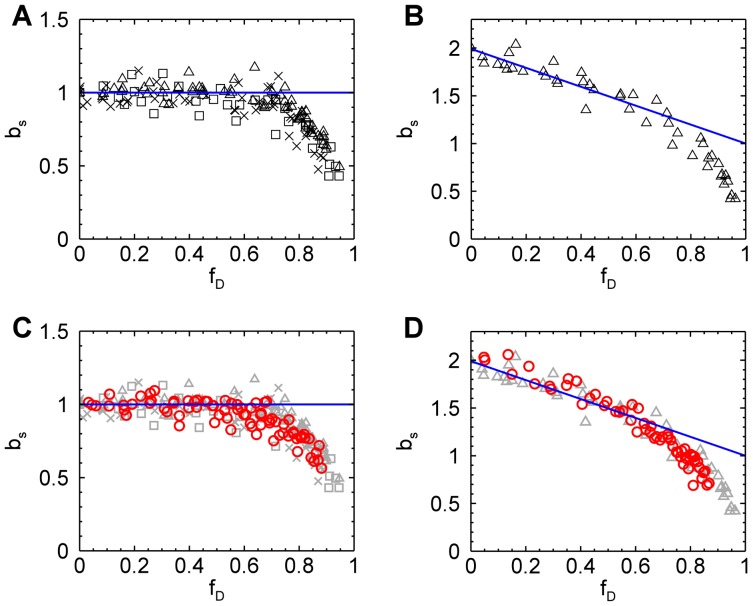
Figure 6. Segmented brightness of EGFP and EGFP2 in mammalian and yeast cells versus photodepletion fraction.
Photobleaching of mammalian cells was accomplished by one-photon excitation, while yeast cells were photobleached by two-photon excitation. (A) The normalized brightness of EGFP in mammalian cells (five COS cells (triangles), five CV-1 cells (squares), six MRC5 cells (crosses)) is close to the theoretical value (blue line) until the photodepletion fraction exceeds 0.6, at which point it begins to drop. (B) The normalized brightness of EGFP2 in mammalian cells agrees with theory (blue line) until the photodepletion fraction reaches 0.6. (C) The normalized brightness of EGFP from three yeast cells (red circles) shows the same behavior as seen in mammalian cells (grayed symbols, same as shown in panel A). (D) The normalized brightness of EGFP2 from two yeast cells (red circles) close follows the brightness observed in mammalian cells (grayed symbols, same as shown in panel B).

