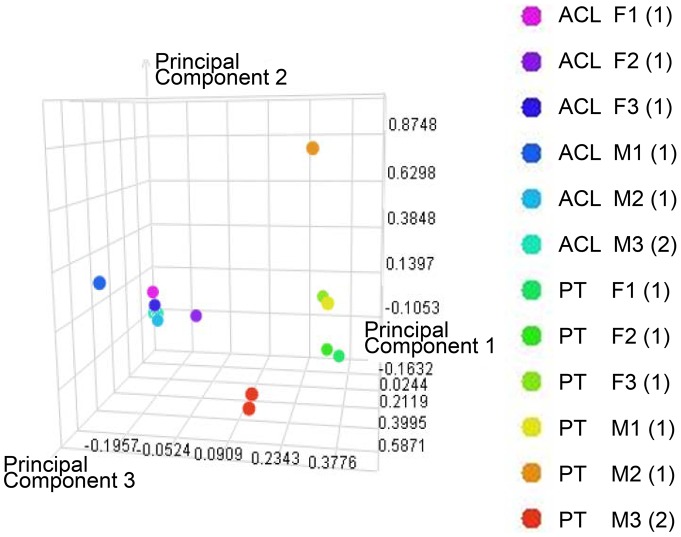
Figure 1. Principal components analysis (PCA) using the peptide-level quantitative data from Tables S1 and S2.
PCA after z-score normalization and calculation of the top 3 principal components. ACL, anterior cruciate ligament; PT, patellar tendon; M1–3, male donor 1–3; F1–3, female donor 1–3. Number in brackets represents number of technical replicates performed.

