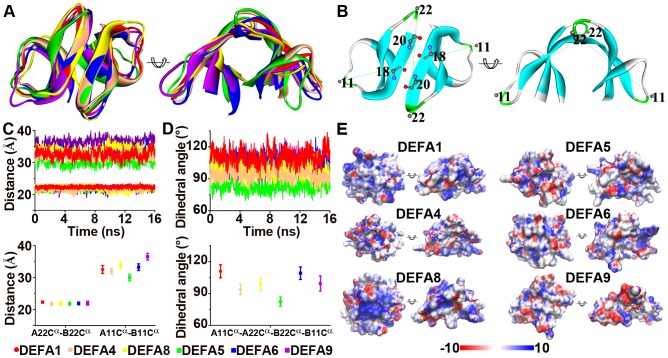
Figure 3. Structural flexibility and surface electrostatic potential for the simian myeloid and enteric α-defensin dimers.
A: Superimposed α-defensin dimers for the myeloid DEFA1, DEFA4 and DEFA8 proteins as well as the enteric DEFA5, DEFA6 and DEFA9 proteins. B: Diagram illustrating the intermolecular hydrogen bonds, the two distances (A22Cα-B22Cα and A11Cα-B11Cα) and the dihedral angle (A11Cα-A22Cα-B22Cα-B11Cα). C: Plots of the A22Cα-B22Cα and A11Cα-B11Cα distances during the 16 nanoseconds of molecular dynamics simulations (upper panel) and plots of the average A22Cα-B22Cα and A11Cα-B11Cα distances (lower panel). Similar A22Cα-B22Cα distances indicate that the dimer structures are well maintained during simulation processes, whereas diverse A11Cα-B11Cα distances reflect the flexibility of the dimers. Error bars represent standard deviations. D: Plots of the dihedral angle A11Cα-A22Cα-B22Cα-B11Cα. The variant dihedral angles among different clusters of myeloid and enteric α-defensins indicate different dimer topologies. E: Surface electrostatic potential generated using the smoothed trajectory from the last five frames of molecular dynamics simulations. The electrostatic potential (±10 kT/e) is colored red (−) or blue (+). The left and right views of each structure are the same as in panel A.

