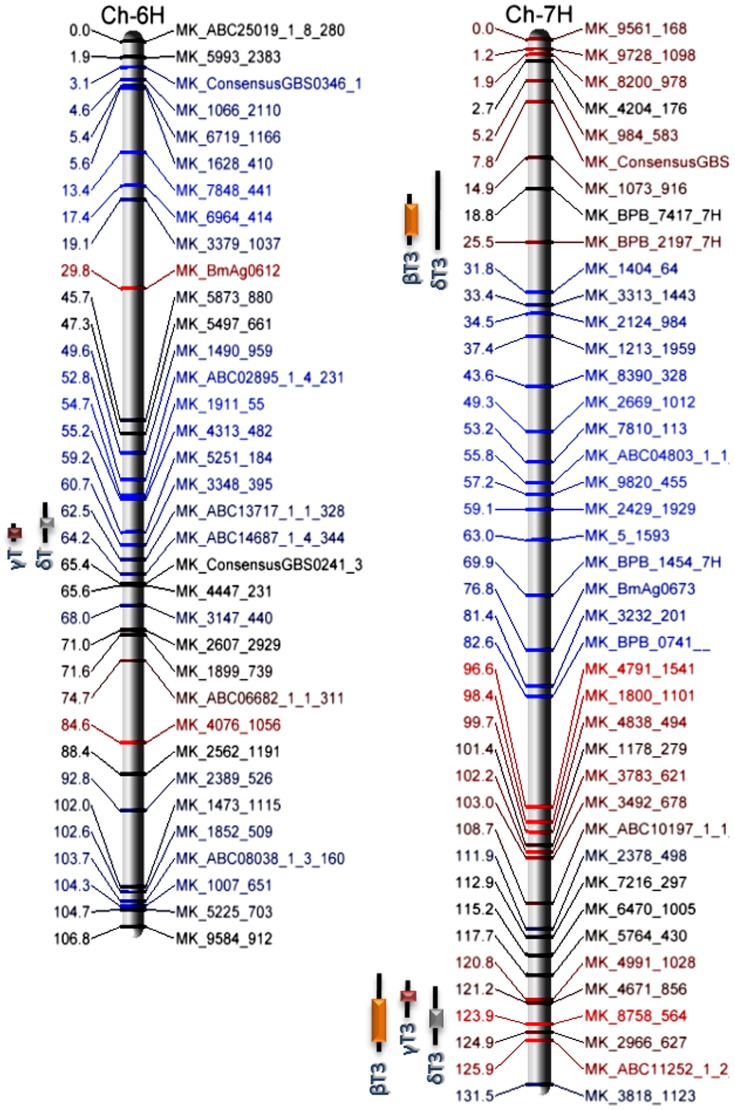
Figure 2. Major QTL regions influencing tocochromanol biosynthesis in the barley Falcon x Azhul RIL population.
QTL common to all environments are indicated by a colored bar. Black extensions indicate regions affected by at least one environment. Marker names and map positions are colored by additive effect of parental alleles. Blue indicates a greater influence of the Falcon allele; red a greater influence of Azhul.

