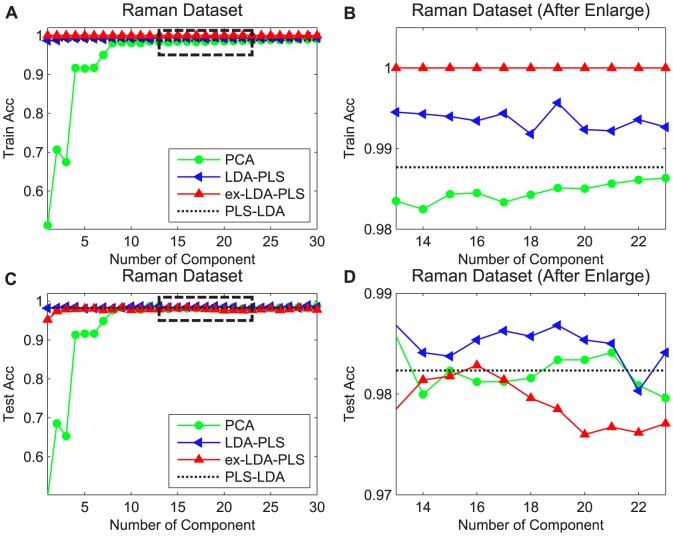
Figure 4. Recognition rates vs. number of components on PCA, LDA-PLS, ex-LDA-PLS and PLS-LDA in Raman dataset.
Acc represent classification accuracy. Green lines with circle represent the results of PCA, blue lines with left triangle are LDA-PLS classification results, red lines with up triangle are the ex-LDA-PLS results, and black dot lines are the mean result of PLS-LDA.

