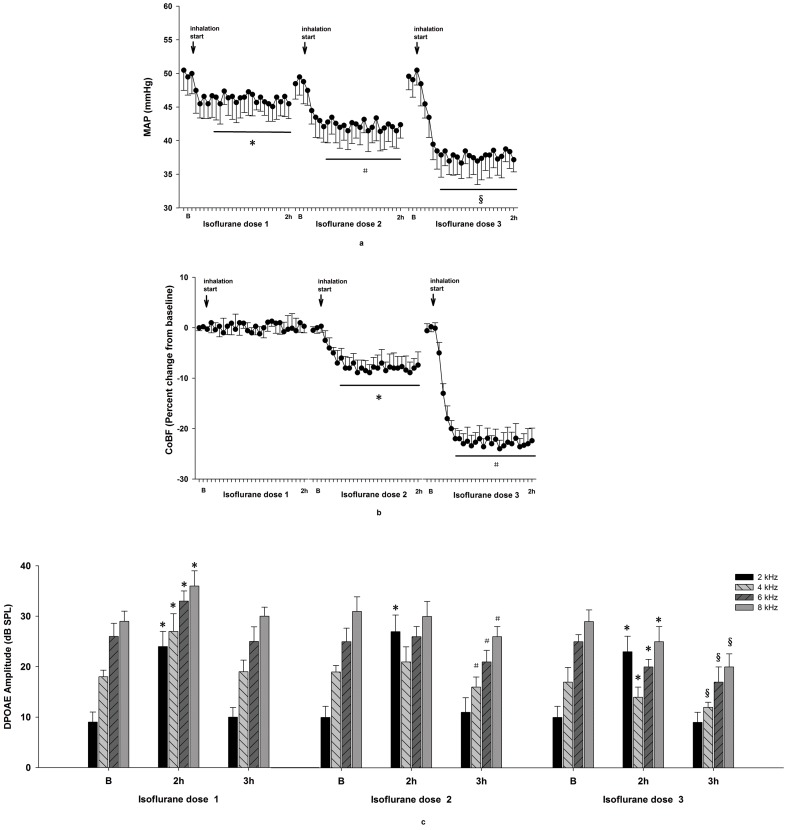
Figure 2. Effects of isoflurane on MAP, CoBF, and DPOAE.
1.15% (isoflurane dose 1), 2.30 vol% (isoflurane dose 2), and 3.45 vol% (isoflurane dose 3) were inhaled for 2 h. A, MAP values. * P<0.05 MAP 20 min after inhalation vs B. # P<0.01 MAP 20 min after inhalation vs B. § P<0.005 MAP 20 min after inhalation vs B. B, CoBF values. * P<0.01 CoBF 25 min after inhalation vs B. # P<0.005 CoBF 25 min after inhalation vs B. C, DPOAE amplitudes. * P<0.01 DPOAE amplitude 2 h after inhalation vs B. # P<0.01 DPOAE amplitude 1 h after the stop of isoflurane dose 2 vs B. § P<0.05 DPOAE amplitude 1 h after the stop of isoflurane dose 3 vs DPOAE amplitude 1 h after the stop of isoflurane dose 2.

