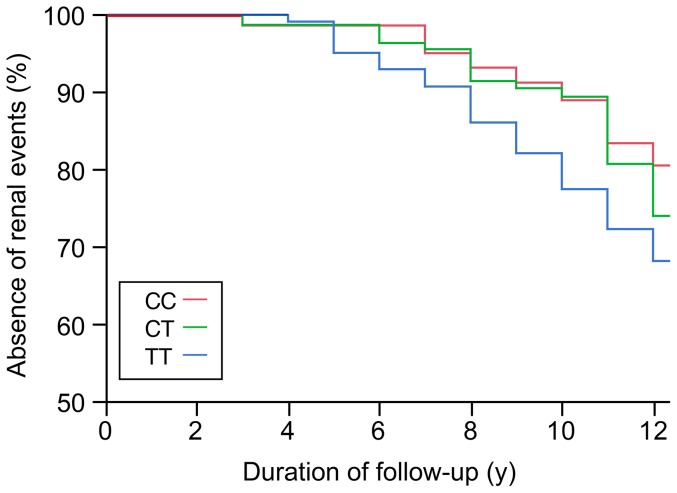
Figure 1. Kaplan-Meier survival (renal event-free) curve during follow-up in the SURGENE cohort by SOD2 rs4880 genotypes: TT (n = 108), TC (n = 158), CC (n = 74).
Y-axis represents the absence of renal events defined as new cases of microalbuminuria or progression to a more severe stage of nephropathy.

