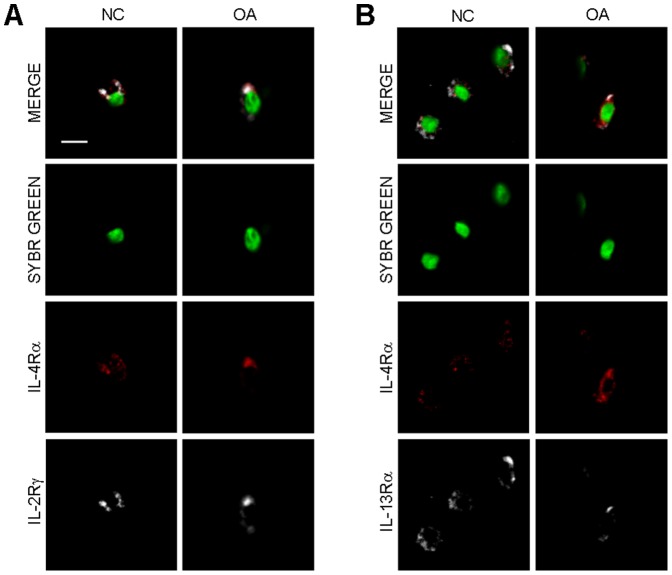
Figure 3. Co-localization of IL-4R subunits expressed in normal and OA cartilage.
A: a representative example of IL-4Rα and IL-2Rγ colocalization (IL-4 Receptor type I) in control and OA cartilage. B: a representative example of IL-4Rα and IL-13Rα1 (IL-4 Receptor type II) in control and OA cartilage (bar = 10 µm). Panels show IL-4R staining (Dy Light 647, rendered in red), either IL-2Rγ or IL-13Rα (Alexa 555, rendered in white), nuclear counterstaining (sybr green, rendered in green) and merged signals.

