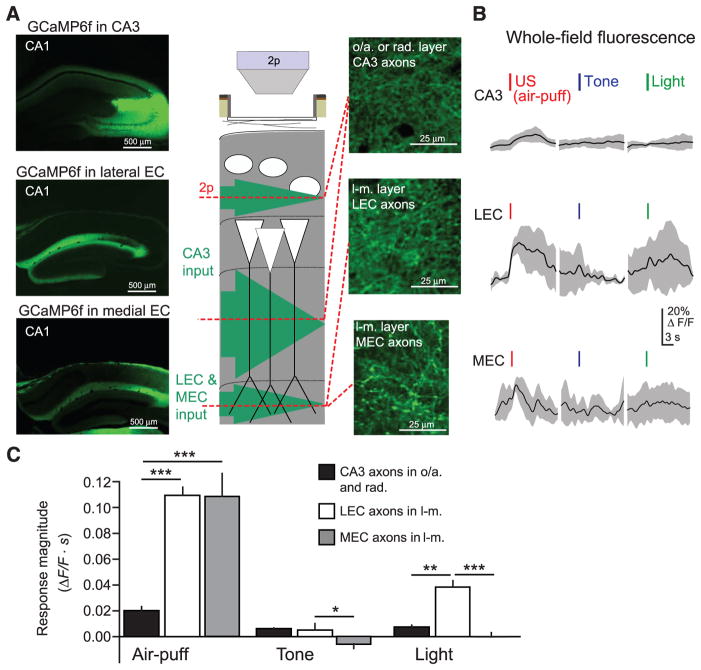
Fig. 4. US-evoked excitatory input to CA1 PC distal dendrites.
(A) (Left) Confocal images of coronal sections from dorsal hippocampus, showing expression of GCaMP6f in CA1-innervating axons from CA3 (top), LEC (middle), or MEC (bottom). (Middle) Schematic of recording configuration, with 2p imaging from excitatory axons in the oriens/radiatum layers (CA3 projections) or lacunosum-moleculare layer (LEC or MEC projections) of CA1. (Right) Example in vivo 2p images of GCaMP6f-expressing axons in CA1 (CA3, top; LEC, middle; MEC, bottom). (B) Example mean whole-field fluorescence traces from CA3, LEC, and MEC axons [examples in (A)], in response to discrete sensory stimuli (mean with shaded SD). (C) Summary data for sensory stimulation experiments. Responses are quantified as the mean integral of ΔF/F over the 3 s after the stimulus (two-way ANOVA, axon type x stimulus type, F(4,84) = 10.7, P < 0.001; post hoc Mann-Whitney U tests). Error bars, mean ± SEM. *P < 0.05; **P < 0.01; ***P < 0.001.

