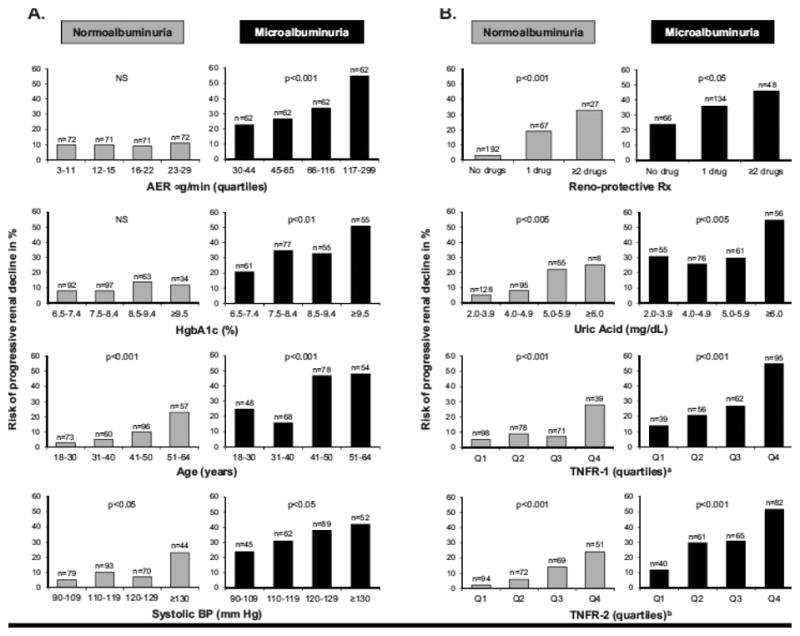
Figure 6.

Risk of progressive renal decline according to categories of baseline clinical characteristics (Panel A) and serum markers (Panel B) and according to study groups. Data from the 2nd Joslin Study on Natural History of Microalbuminuria in T1D. Figure reprinted from ref. 27.
a cut points for circulating TNFR1 for 25th, 50th, and 75th percentiles were:1173, 1394, 1685 pg/ml
b cut points for circulating TNFR2 for 25th, 50th, and 75th percentiles were: 1810, 2186, 2690 pg/ml
