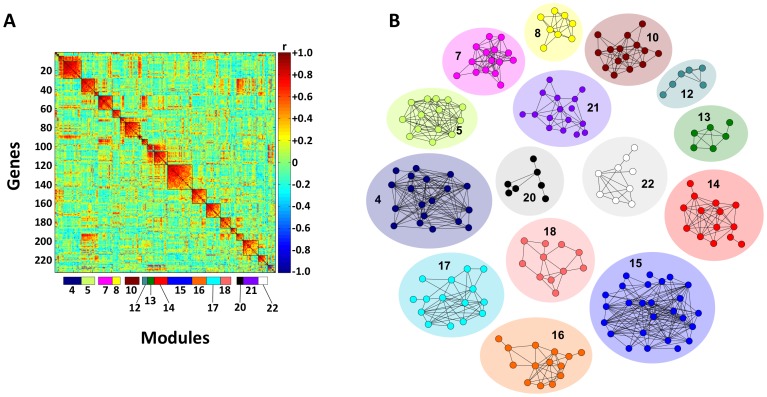
Figure 3. Modulated modularity clustering (MMC) heat map revealing modules of genes that covary in expression and relevance networks for genes within the modules.
(A) MMC analysis of transcript expression levels for the top 233 genes identifying 23 gene modules. (B) Relevance networks for genes correlated within MMC modules obtained by enforcing an absolute correlation threshold of |r|≥0.6. Only networks containing 5 or more genes are depicted. Color-coding of the relevance networks by gene module corresponds to that shown in the horizontal bar under the heat map in (A).

