
Figure 4. Matrix of a subset of genes that co-vary in expression and share GO classes or functional pathways.
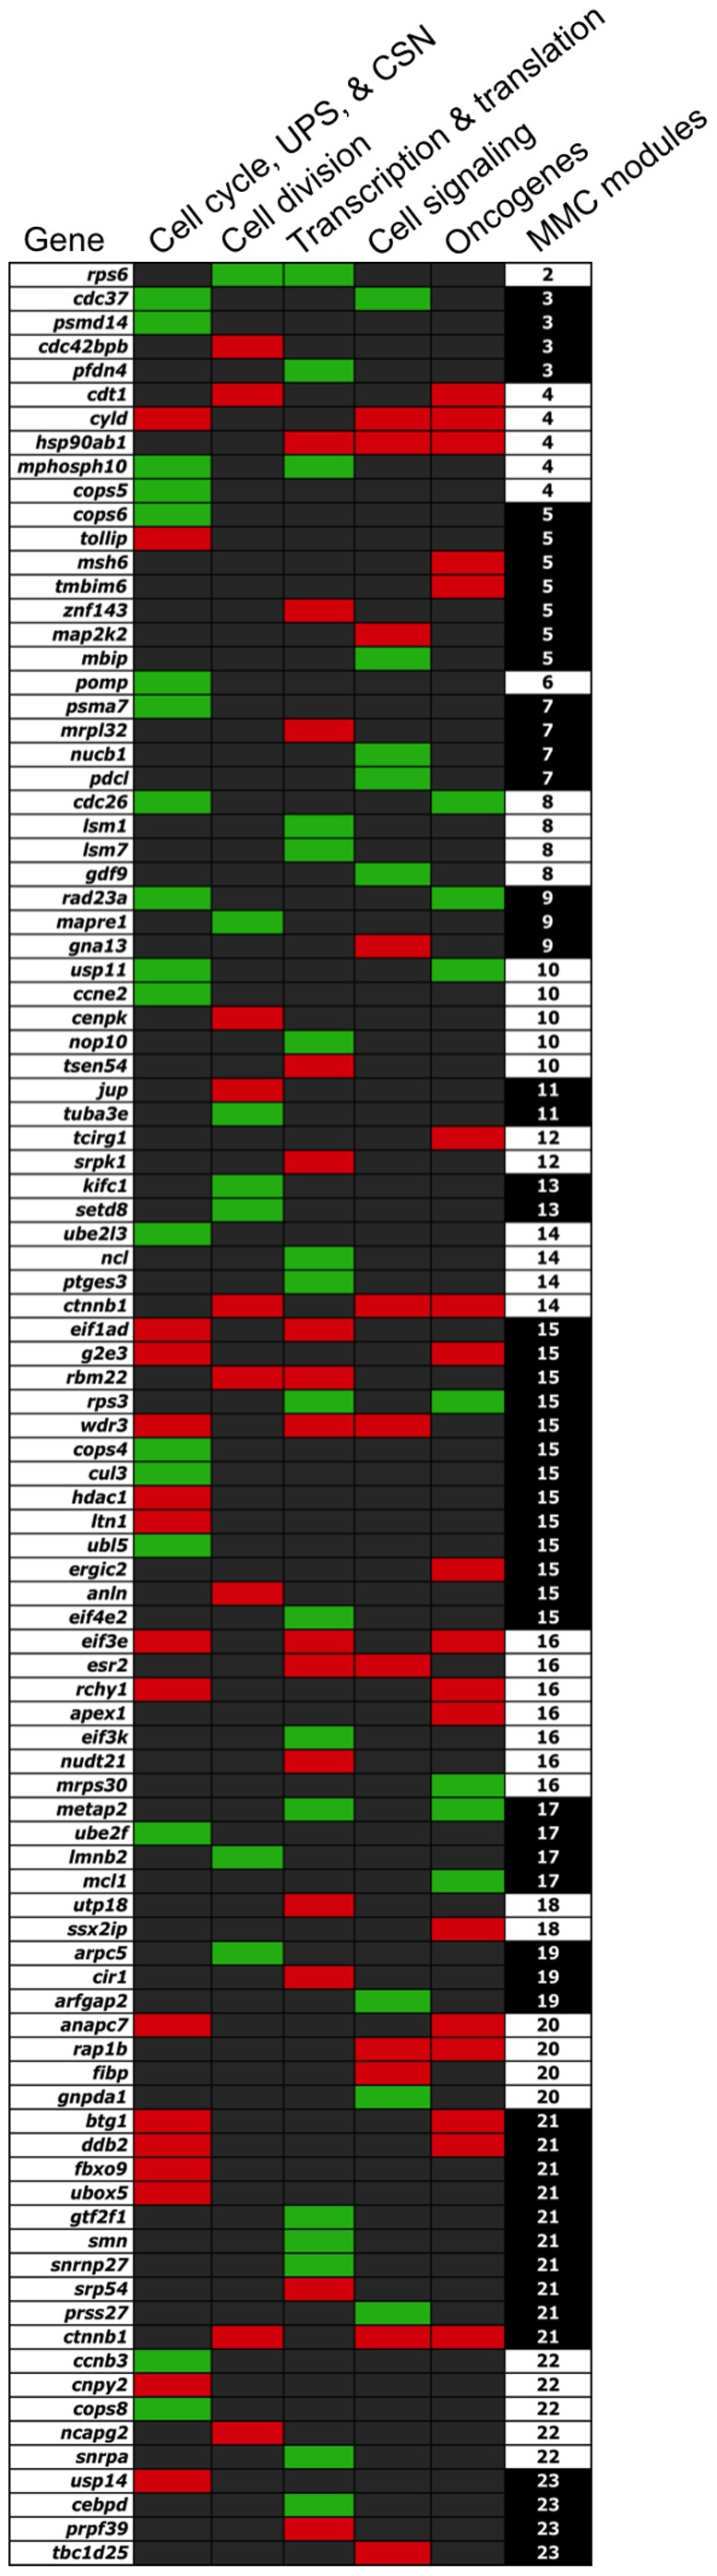
Presence of a red or green box indicates assignment of a gene to a functional category and up- or down-regulation, respectively, in fish spawning poor quality eggs (see also Table S2). MMC module indicates gene assignment to networks depicted in Fig. 3.