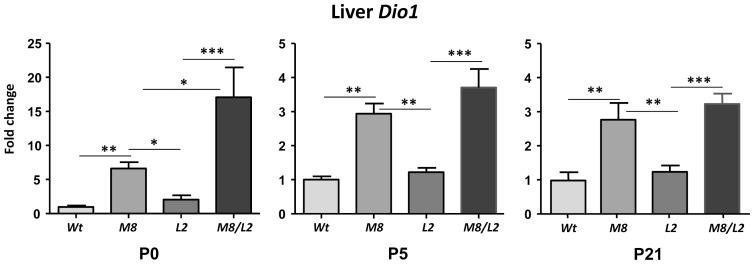
Figure 4. Type 1 deiodinase (Dio1) expression (mean ± SE) in the liver.
Wt = wild type mice; M8 = Mct8KO; L2 = Lat2KO; M8L2 = Mct8Lat2KO. Measurements were by qPCR, and the data expressed relative to 18S RNA. Note the different scale for the P0 data with respect to P5 and P21. Significance of differences was calculated by one way ANOVA and the Tukey posthoc test. Only relevant significant comparisons are indicated. ** P<0.01. *** P<0.001. P5, P21: postnatal days 5 or 21.

