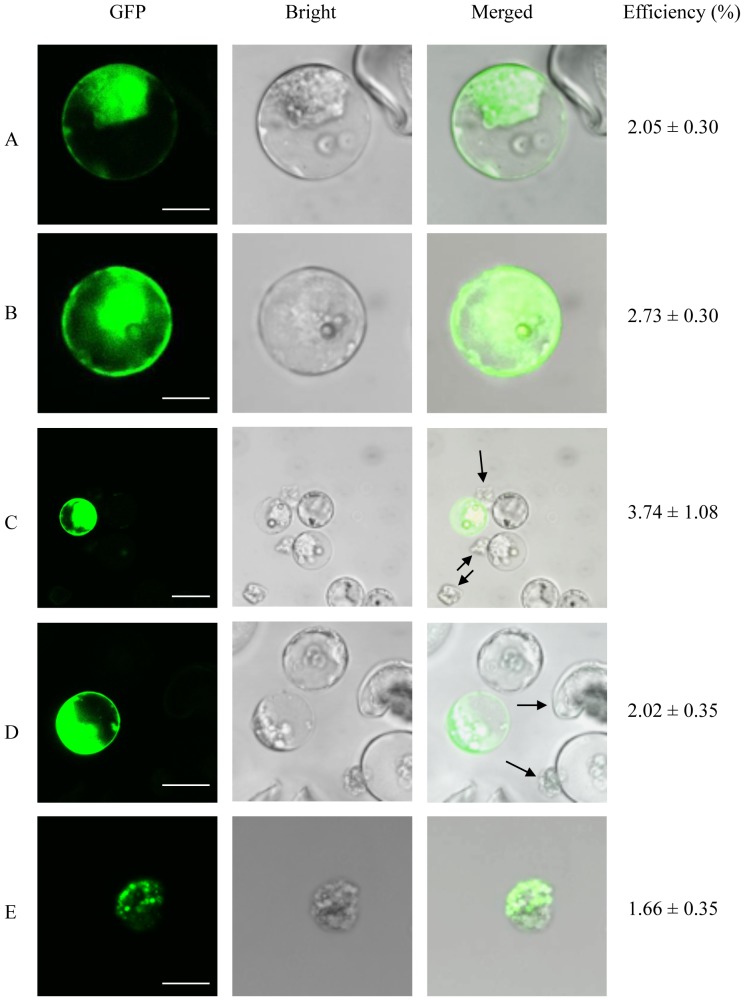
Figure 3. Effects of DNA and PEG concentrations on transfection efficiency.
Oil palm protoplasts were transfected with 25 µg (A) or 50 µg (B) of CFDV-hrGFP plasmid DNA, and with 50 µg CFDV-hrGFP plasmid DNA in the presence of 25% (C), 40% (D) or 50% PEG (E). Black arrows indicate damaged protoplasts caused by PEG toxicity. The transfection efficiencies represent the mean of three replicates. Scale bar = 10 µm in (A) and (B), 25 µm in (C)–(F).

