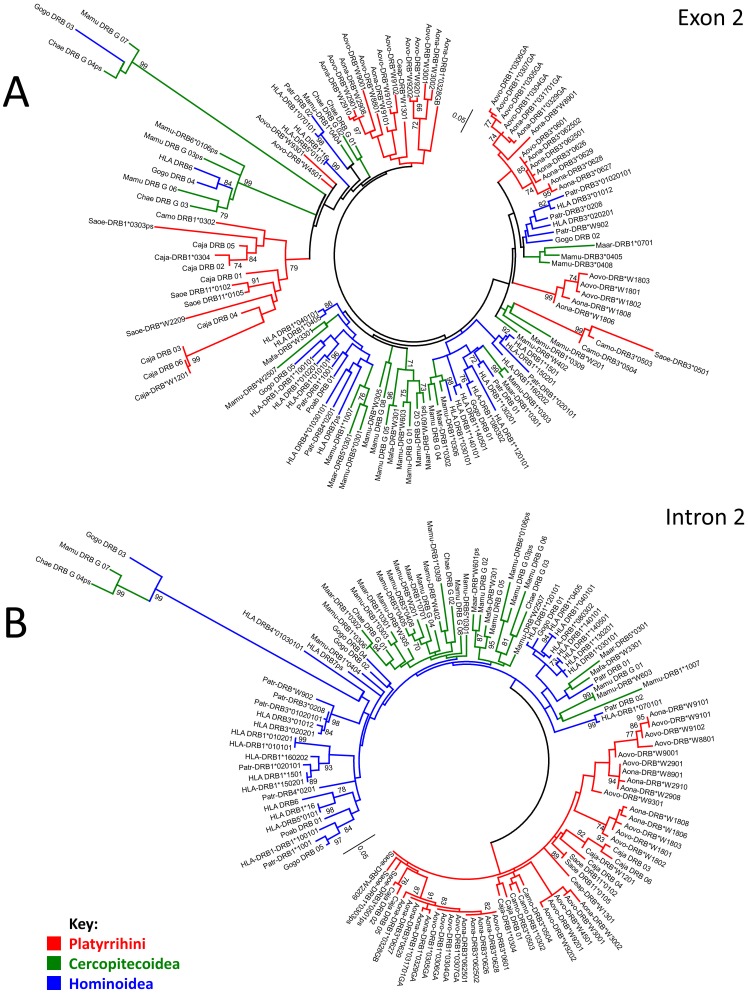
Figure 5. Maximum likelihood trees. A. Maximum likelihood tree constructed from Aotus MHC-DRB exon 2 sequences (120 OTUs, 271 aligned positions).
The analysis involved using Kimura's 2 parameter model with invariable positions and Gamma distribution (5 categories, +G, parameter = 0.5550). B Maximum likelihood tree constructed from Aotus MHC-DRB alignable sectors of intron 2 (132 OTUs, 359 aligned positions). The analysis involved using the general time reversible model with invariable positions and Gamma distribution (5 categories, +G, parameter = 1.2072). >70% bootstrap values are displayed. The bootstrap test involved using 1,000 replicates. The scale bar represents substitutions per site. Abbreviations and GenBank accession numbers for the sequences compared here are shown in Table S1 (within File S1).

