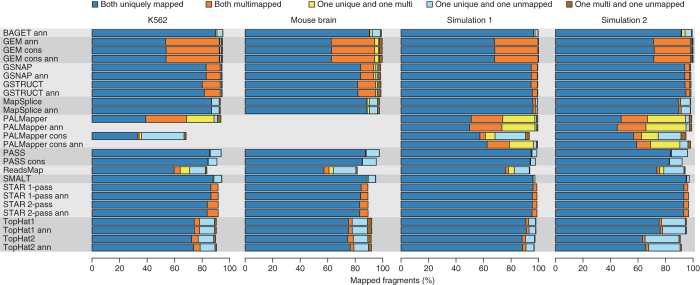
Figure 1. Alignment yield.
Shown is the percentage of sequenced or simulated read pairs (fragments) mapped by each protocol. Protocols are grouped by the underlying alignment program (gray shading). Protocol names contain the suffix “ann” if annotation was used. The suffix “cons” distinguishes more conservative protocols from others based on the same aligner. The K562 data set comprises six samples, and the metrics presented here were averaged over them.

