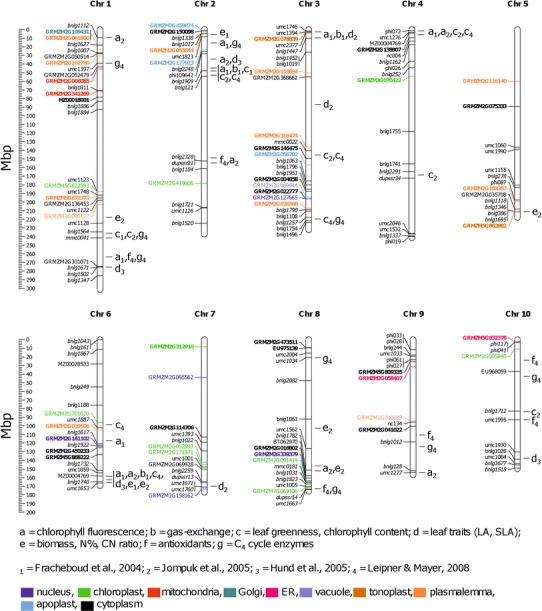
Fig. 4.

Chromosomal localization of genes responding differentially to cold treatment in the two maize lines and of QTLs associated with morpho-physiological traits expressed under low temperature conditions. On a physical map of maize chromosomes marked are positions of genes showing statistically significant (p < 0.1) interaction of line and temperature effects; molecular markers used to construct the ETH-DH7 × ETH-DL3 genetic map (Fracheboud et al. 2004); and QTLs found by Fracheboud et al. (2004), Hund et al. (2005), Jompuk et al. (2005), and Leipner and Mayer (2008). Coordinates of genes represented by microarray probes are given according to the Maize Genome Sequencing Project, and of molecular markers according to the MaizeGDB. Markers of known or estimated localization are shown in normal or italic typeface, respectively. Bold typeface indicates more-positive or less-negative expression change of a gene in response to cold in ETH-DH7 than in ETH-DL3. Detailed data on proteins identified by ensembl gene ID are given in Table S3. Different colors indicate the predicted cellular localization of products of genes responding differentially to cold treatment following the color-code at the bottom of the figure
