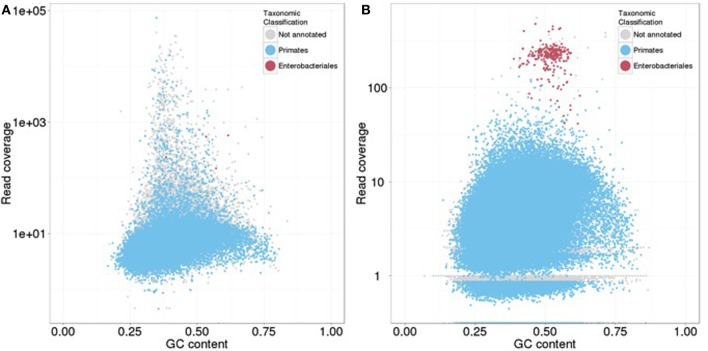
Figure 9.
Taxon-annotated GC-coverage (TAGC) plots from a subset of randomly selected contigs for the mock-contaminated E. coli-human library. (A) TAGC-plot generated after alignment to a random subset of contigs (5) from CLC assembly; (B) TAGC-plot generated after alignment to to a random subset of contigs (5) from the SOAPdenovo2 assembly. Individual contigs are plotted based on GC (X axis) and read coverage (Y axis, logarithmic scale). Contigs are colored according to the taxonomic order of the best megablast match to the NCBI nt database (with E-value < 1e-50). Contigs without an annotated BLAST match are shown in gray.

