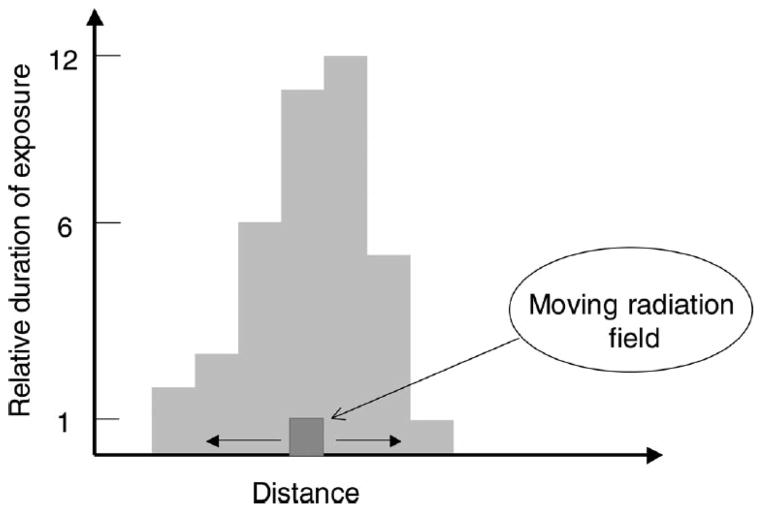
FIG. 2.
Simulation of a hypothetical composite non-uniform field. The x axis indicates the location of the collimated radiation field along a line from anterior to posterior (for a lateral field) or left to right (for a frontal field). The y axis indicates the beam-on time and by extension the relative radiation dose. If the radiation beam is directed at various locations along the x axis for the times indicated on the y axis, the histogram (in Gy) represents the relative dose distribution along the line.

