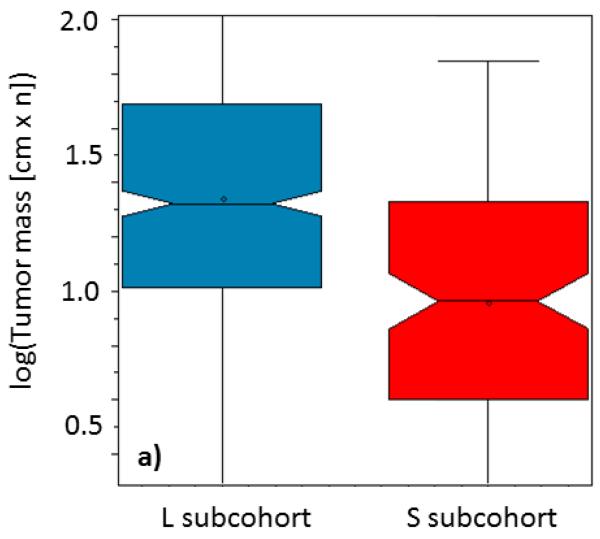
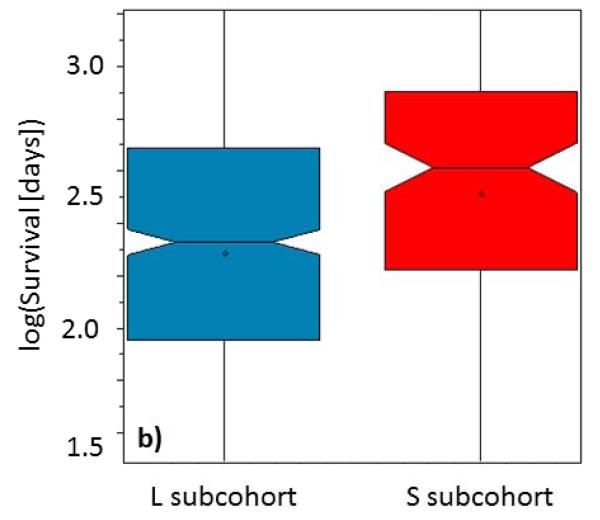
Figure 2.
Boxplots representing distributions of the a) tumor masses (logarithm of maximal tumor size in cm × number of nodules) and b) overall survivals (logarithm of survival in days) for the patients, classified by the previously developed 9-variable logistic regression model, computing odds for S (red) and L (blue) from the distances of patients personal relationship profile graphs from graphs of reference relationship patterns. Box notches indicate distribution means.


