
Figure 4.
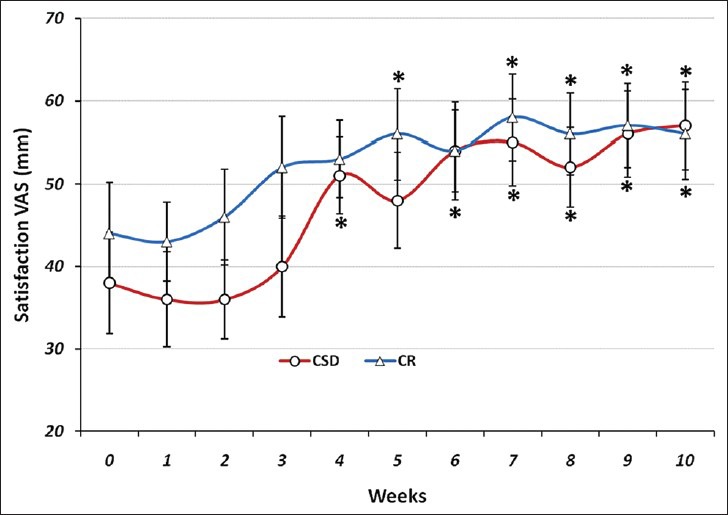
The VAS for satisfaction during each stage of study at CSD and CR regimen. The graph shows the mean values which was obtained at the end of each week of study. *P < 0.05 vs baseline value (two-way ANOVA with post hoc Tukey's test)
Official websites use .gov
A
.gov website belongs to an official
government organization in the United States.
Secure .gov websites use HTTPS
A lock (
) or https:// means you've safely
connected to the .gov website. Share sensitive
information only on official, secure websites.
The VAS for satisfaction during each stage of study at CSD and CR regimen. The graph shows the mean values which was obtained at the end of each week of study. *P < 0.05 vs baseline value (two-way ANOVA with post hoc Tukey's test)