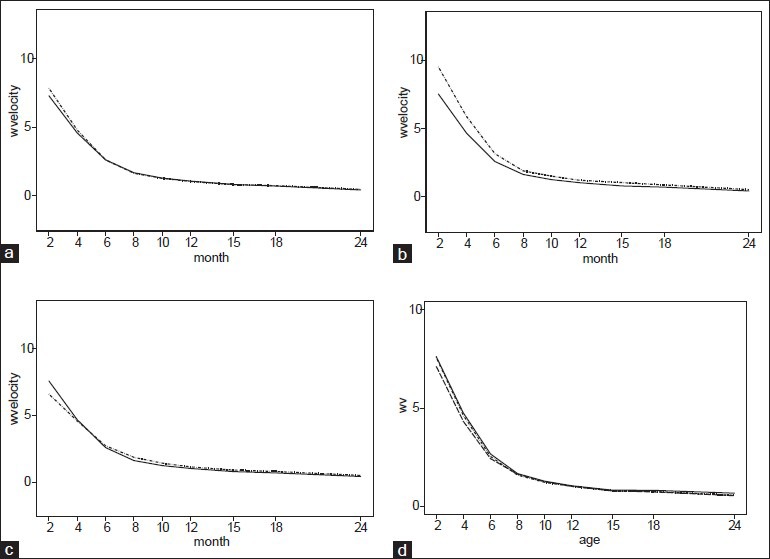
Figure 2.

Weight velocity curves: (a) Weight velocity curve by sex. Girls curve is in solid and boys curve is in dashed line. (b) Weight velocity curve by birth status. Solid line implies full-term and dashed line implies pre-term infants. (c) Weight velocity curves by feeding mode. Solid line implies breast fed and dashed line implies mixed fed infants. (d) Weight velocity curves by child rank in family. The curves of first and second rank are matched and they can see as a solid line. Dashed line implies third rank and upper
