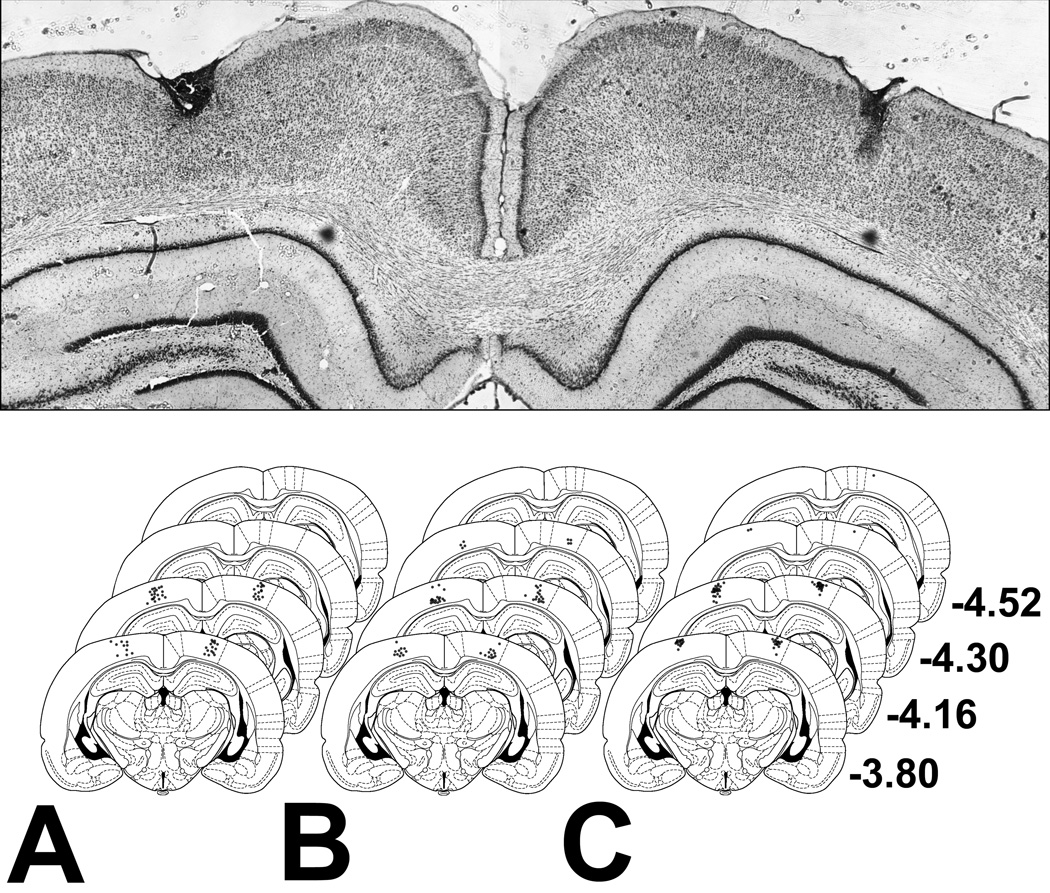
Fig. 1.
(Top) Representative photomicrograph showing cannula tracks. (Bottom) Schematic representation of injector cannula tip placements for rats included in Experiment 1 (A), Experiment 2 (B), and Experiment 3 (C). The numbers on the right indicate distance (mm) from bregma along the rostrocaudal axis. For each placement, a single black dot of 50% opacity was drawn using Adobe Photoshop. Thus, darker areas indicate greater overlap. Coronal brain images were adapted from Paxinos & Watson (1998), with permission from Elsevier.

