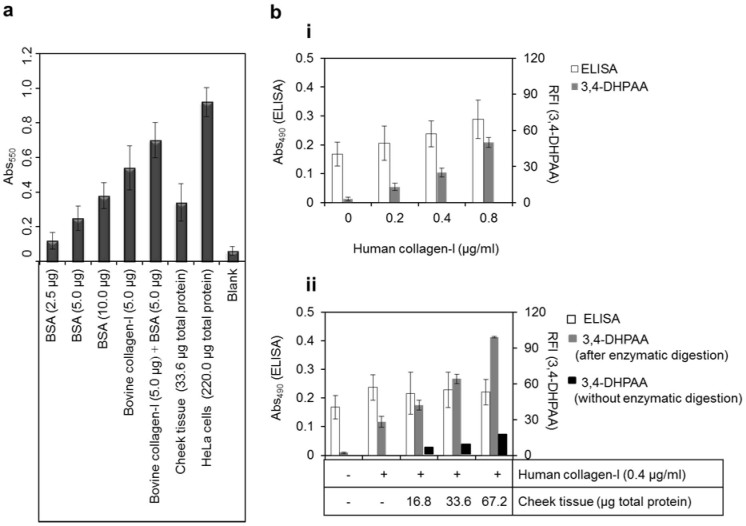
Figure 6. Comparative studies using commercially available kits.
(a) Colorimetric detection of BSA, bovine collagen-I, cheek tissue and HeLa cells with a red dye in picric acid. (b) Comparison of ELISA and 3,4-DHPAA methods for (i) calibration curve of 0–0.8 μg/ml human collagen-I, and for (ii) detection of cheek tissue in the presence or absence of 0.4 μg/ml human collagen-I. Each bar is the mean ± SD of three repeated experiments.

