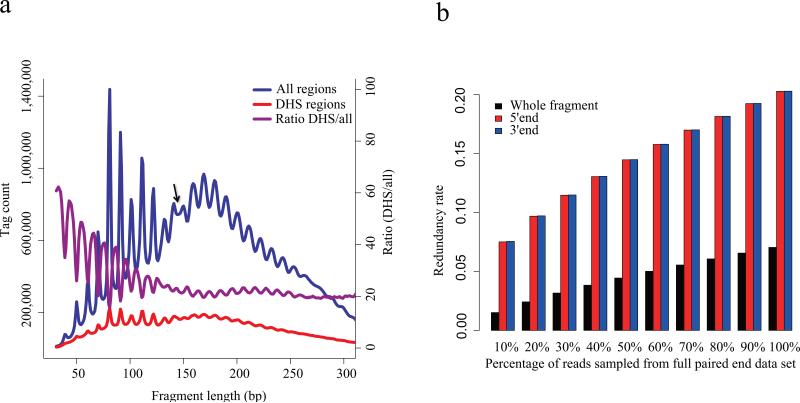
Figure 3. Pair-end sequencing of DHS.
(a) Fragment size distribution of DNase-seq data produced through paired end sequencing. The overall distribution (blue) exhibits an approximately 10.4bp periodicity that is consistent with one complete turn of the double helix. This phenomenon is likely to arise from nucleosomal DNA where DNase cleavage is possible only at exposed sites on the nucleosome. The arrow marks the point at which there is a shift in this periodic pattern. This periodicity is weaker in the distribution of fragment lengths in DHS regions (red). The ratio of fragments in the DHS regions relative to the entire fragment populations (purple) shows that the short fragments are enriched in the DHS regions. The periodicity in this ratio reflects a depletion of nucleosome associated fragments in the DHS regions. (b) Redundancy rate calculated from sampling pair-end DNase-seq data. Whole fragments as determined by the pair-end sequencing of both ends of DNA fragments are far less redundant than the 5’ and 3’ ends taken in isolation from each other.

